the table shows the ages and weights of babies at a hospital. newborn class weight check\n| age (weeks) | 1…
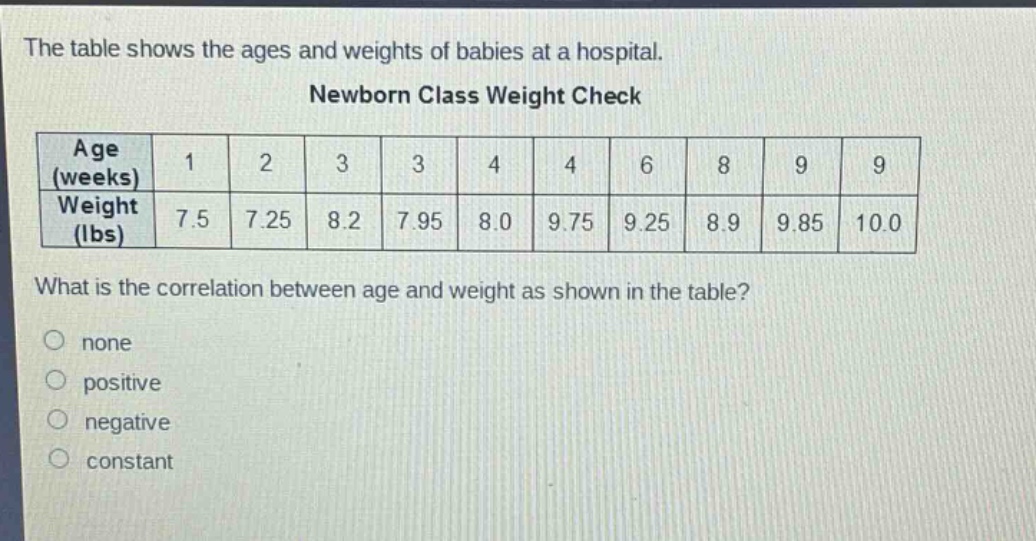
the table shows the ages and weights of babies at a hospital. newborn class weight check\n| age (weeks) | 1 | 2 | 3 | 3 | 4 | 4 | 6 | 8 | 9 | 9 |\n|--|--|--|--|--|--|--|--|--|--|--|\n| weight (lbs) | 7.5 | 7.25 | 8.2 | 7.95 | 8.0 | 9.75 | 9.25 | 8.9 | 9.85 | 10.0 |\nwhat is the correlation between age and weight as shown in the table?\nnone\npositive\nnegative\nconstant
Answer
Answer:
B. positive
Explanation:
Step1: Observe data trend
As age (weeks) increases from 1 to 9, weight (lbs) generally increases. For example, at 1 week the weight is 7.5 lbs and at 9 weeks it is 10.0 lbs. There are some minor fluctuations but the overall trend is upward. So, there is a positive correlation between age and weight.