the table shows the average number of hours of daylight per day for the last four months of the year. what…
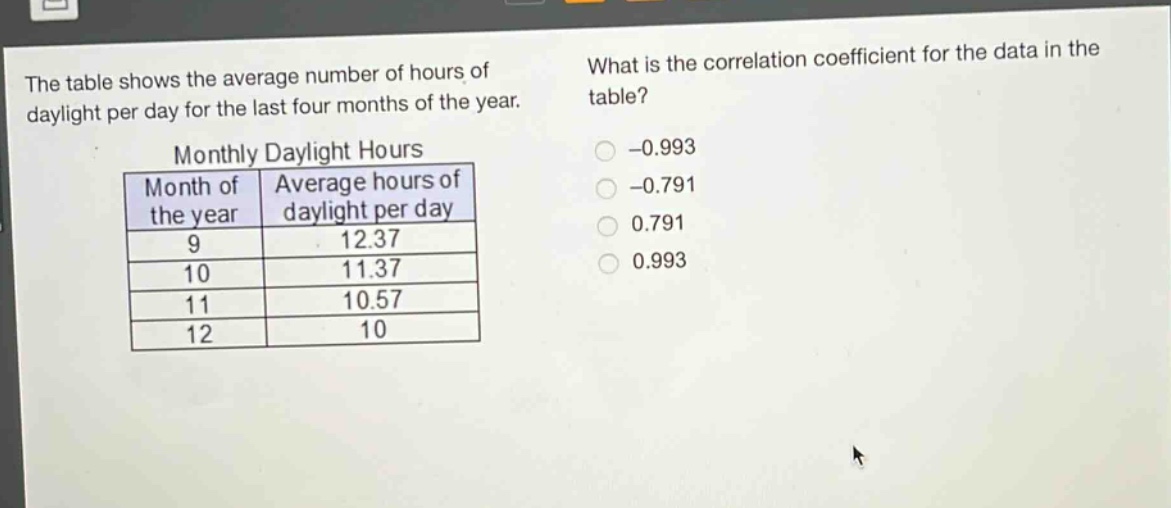
the table shows the average number of hours of daylight per day for the last four months of the year. what is the correlation coefficient for the data in the table? monthly daylight hours month of the year average hours of daylight per day 9 12.37 10 11.37 11 10.57 12 10 -0.993 -0.791 0.791 0.993
Answer
Explanation:
Step1: Identify data sets
Let $x$ be month number ($9, 10, 11, 12$) and $y$ be average - daylight hours ($12.37, 11.37, 10.57, 10$).
Step2: Observe trend
As the month number $x$ increases, the average - daylight hours $y$ decreases. So the correlation is negative.
Step3: Analyze strength
The relationship seems to be quite strong as the decrease in daylight hours is relatively consistent as the months progress. A value close to - 1 indicates a strong negative linear relationship.
Answer:
-0.993