the table shows the battery lives, in hours, of ten brand a batteries and ten brand b batteries.\nbattery…
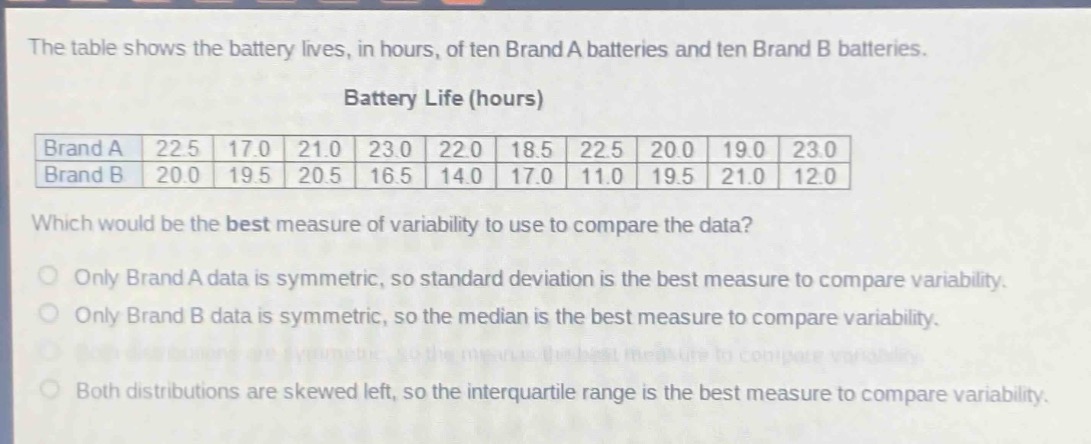
the table shows the battery lives, in hours, of ten brand a batteries and ten brand b batteries.\nbattery life (hours)\n|brand a|22.5|17.0|21.0|23.0|22.0|18.5|22.5|20.0|19.0|23.0|\n|brand b|20.0|19.5|20.5|16.5|14.0|17.0|11.0|19.5|21.0|12.0|\nwhich would be the best measure of variability to use to compare the data?\nonly brand a data is symmetric, so standard deviation is the best measure to compare variability.\nonly brand b data is symmetric, so the median is the best measure to compare variability.\nboth distributions are symmetric, so the mean is the best measure to compare variability.\nboth distributions are skewed left, so the interquartile range is the best measure to compare variability.
Answer
Brief Explanations:
When data is symmetric, standard - deviation is a good measure of variability. When data is skewed, the inter - quartile range is a better measure as it is less affected by outliers. By looking at the data values of Brand A and Brand B, we can see that the data for both brands is skewed left. The inter - quartile range is resistant to extreme values in skewed data.
Answer:
Both distributions are skewed left, so the interquartile range is the best measure to compare variability.