the table below shows the conditional relative frequencies of a set of data comparing gender and whether an…
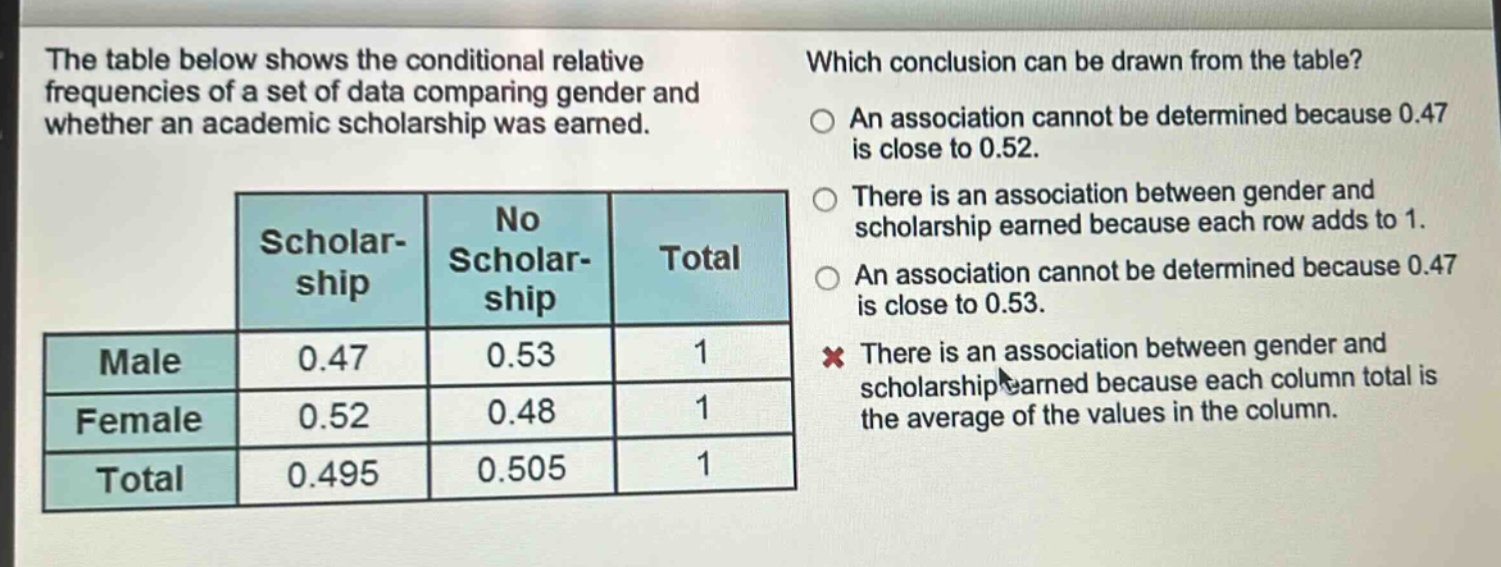
the table below shows the conditional relative frequencies of a set of data comparing gender and whether an academic scholarship was earned. which conclusion can be drawn from the table? an association cannot be determined because 0.47 is close to 0.52. there is an association between gender and scholarship earned because each row adds to 1. an association cannot be determined because 0.47 is close to 0.53. there is an association between gender and scholarship earned because each column total is the average of the values in the column.\n| |scholar - ship|no scholar - ship|total| |---|---|---|---| |male|0.47|0.53|1| |female|0.52|0.48|1| |total|0.495|0.505|1|
Answer
Explanation:
Step1: Analyze association concept
In conditional - relative frequency tables, if the conditional relative frequencies for one variable are different for different categories of the other variable, there is an association. Here, the proportion of males who earned a scholarship (0.47) is different from the proportion of females who earned a scholarship (0.52). Also, the proportion of males who did not earn a scholarship (0.53) is different from the proportion of females who did not earn a scholarship (0.48).
Step2: Evaluate answer choices
- The first and third options say an association cannot be determined because of closeness of values. But 0.47 and 0.52 (or 0.47 and 0.53) are different enough to suggest an association.
- The second option's reasoning that each row adds to 1 is not relevant for determining association.
- The correct way to think is that the differences in conditional relative frequencies for males and females in the "Scholarship" and "No Scholarship" categories indicate an association.
Answer:
There is an association between gender and scholarship earned because the conditional - relative frequencies for males and females in the "Scholarship" and "No Scholarship" categories are different.