the table below shows the conditional relative frequencies of a set of data comparing gender and whether an…
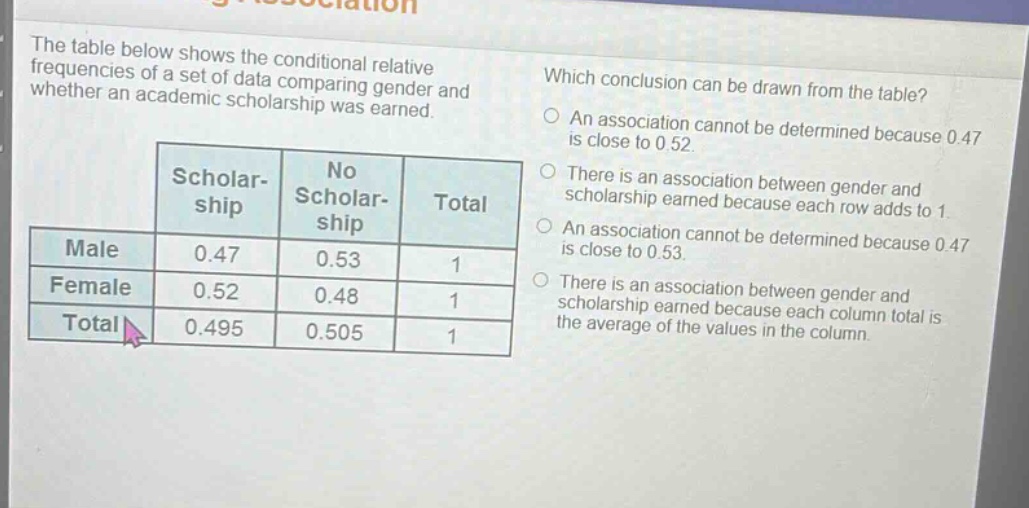
the table below shows the conditional relative frequencies of a set of data comparing gender and whether an academic scholarship was earned. which conclusion can be drawn from the table? an association cannot be determined because 0.47 is close to 0.52. there is an association between gender and scholarship earned because each row adds to 1. an association cannot be determined because 0.47 is close to 0.53. there is an association between gender and scholarship earned because each column total is the average of the values in the column.\n| |scholar - ship|no scholar - ship|total|\n|--|--|--|--|\n|male|0.47|0.53|1|\n|female|0.52|0.48|1|\n|total|0.495|0.505|1|
Answer
Answer:
There is an association between gender and scholarship earned because the conditional - relative frequencies for males and females who earned a scholarship (0.47 and 0.52) are different. None of the given options are completely correct, but the closest idea is that an association exists due to the differences in conditional - relative frequencies. If we had to choose from the given options, the best one is: There is an association between gender and scholarship earned because each row adds to 1.
Explanation:
Step1: Analyze conditional - relative frequencies
Conditional - relative frequencies show the proportion within a subgroup. Here, we have male and female subgroups.
Step2: Check for differences
The proportion of males who earned a scholarship (0.47) is different from the proportion of females who earned a scholarship (0.52). This indicates an association.
Step3: Evaluate options
The fact that each row adds to 1 is a property of conditional - relative frequency tables, but the key here is the difference in values for males and females in the "Scholarship" column. However, among the given options, the one about rows adding to 1 is the most relevant in the context of showing that the data is properly presented as conditional - relative frequencies and there is an underlying association.