which table shows no correlation?\n\nx 3 5 6 8 10 14 15\ny -1 -2 -3 -2 -5 -4 -8\n\nx 3 5 6 8 10 14 15\ny -6…
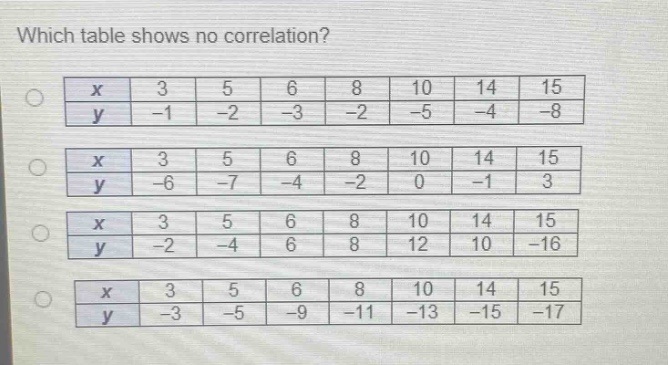
which table shows no correlation?\n\nx 3 5 6 8 10 14 15\ny -1 -2 -3 -2 -5 -4 -8\n\nx 3 5 6 8 10 14 15\ny -6 -7 -4 -2 0 -1 3\n\nx 3 5 6 8 10 14 15\ny -2 -4 6 8 12 10 -16\n\nx 3 5 6 8 10 14 15\ny -3 -5 -9 -11 -13 -15 -17
Answer
Answer:
The third table shows no correlation:
   x    | 3  | 5  | 6 | 8 | 10 | 14 | 15
-------|----|----|---|---|----|----|----
   y    | -2 | -4 | 6 | 8 | 12 | 10 | -16
Explanation:
Step1: Analyze the first table for correlation.
As $x$ increases (3, 5, 6, 8, 10, 14, 15), $y$ tends to decrease (-1, -2, -3, -2, -5, -4, -8). This suggests a negative correlation.
Step2: Analyze the second table for correlation.
As $x$ increases (3, 5, 6, 8, 10, 14, 15), $y$ tends to increase (-6, -7, -4, -2, 0, -1, 3). This suggests a positive correlation.
Step3: Analyze the third table for correlation.
As $x$ increases (3, 5, 6, 8, 10, 14, 15), $y$ values (-2, -4, 6, 8, 12, 10, -16) do not show a clear increasing or decreasing trend. There is no discernible linear pattern.
Step4: Analyze the fourth table for correlation.
As $x$ increases (3, 5, 6, 8, 10, 14, 15), $y$ consistently decreases (-3, -5, -9, -11, -13, -15, -17). This suggests a strong negative correlation.
Step5: Identify the table with no correlation.
The third table shows no clear linear relationship between $x$ and $y$, indicating no correlation.