this table shows the donations that have been made to an animal shelter. if all of the donations were listed…
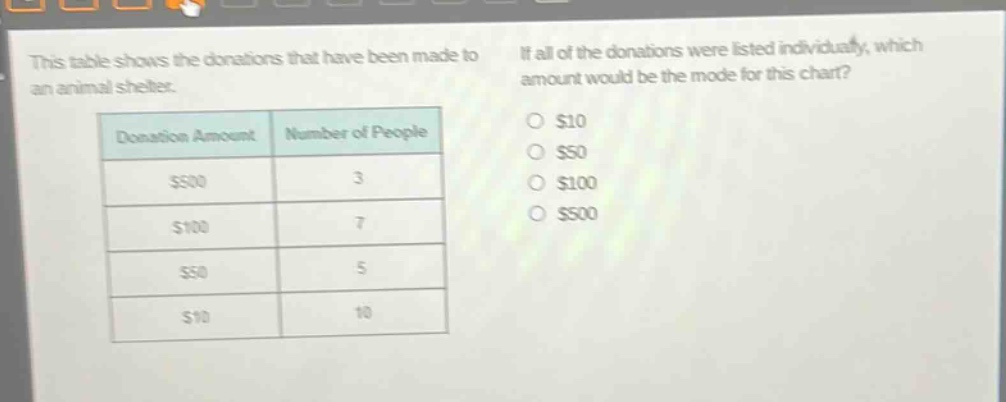
this table shows the donations that have been made to an animal shelter. if all of the donations were listed individually, which amount would be the mode for this chart? donation amount number of people $500 3 $100 7 $50 5 $10 10 $10 $50 $100 $500
Answer
Explanation:
Step1: Recall mode definition
The mode is the value that appears most frequently in a data - set.
Step2: Analyze the frequency of each donation amount
The donation amount of $10 has 10 people donating it, the donation amount of $50 has 5 people donating it, the donation amount of $100 has 7 people donating it, and the donation amount of $500 has 3 people donating it.
Step3: Determine the mode
Since 10 is the highest frequency and it corresponds to the donation amount of $10, the mode is $10.
Answer:
$10