the table shows the estimated number of lines of code written by computer programmers per hour when x people…
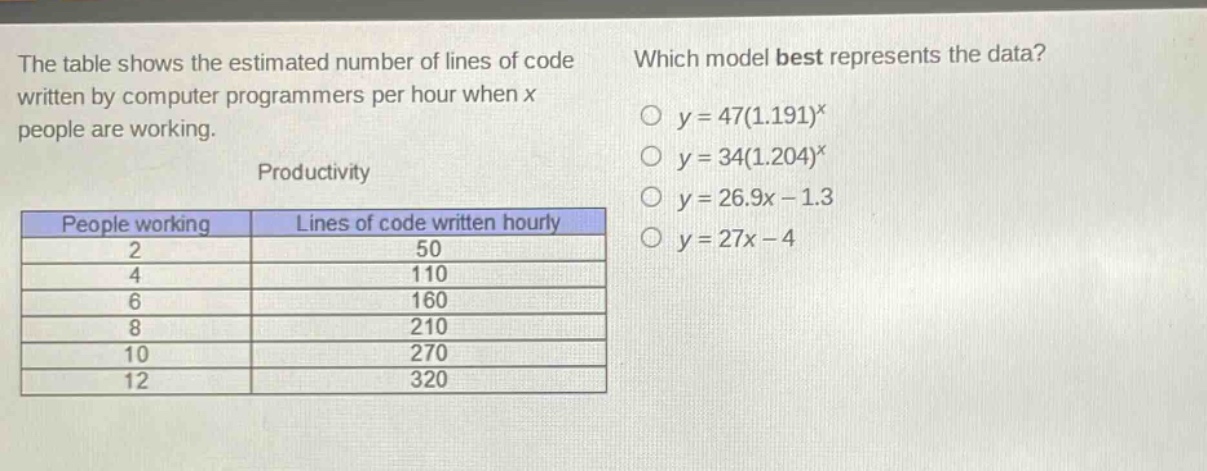
the table shows the estimated number of lines of code written by computer programmers per hour when x people are working. productivity\n| people working | lines of code written hourly |\n| ---- | ---- |\n| 2 | 50 |\n| 4 | 110 |\n| 6 | 160 |\n| 8 | 210 |\n| 10 | 270 |\n| 12 | 320 |\nwhich model best represents the data?\n○ y = 47(1.191)^x\n○ y = 34(1.204)^x\n○ y = 26.9x - 1.3\n○ y = 27x - 4
Answer
Explanation:
Step1: Check linear - form
For a linear model $y = mx + b$, we can find the slope $m$ between two points $(x_1,y_1)$ and $(x_2,y_2)$ using the formula $m=\frac{y_2 - y_1}{x_2 - x_1}$. Let's take $(x_1 = 2,y_1 = 50)$ and $(x_2 = 4,y_2 = 110)$. Then $m=\frac{110 - 50}{4 - 2}=\frac{60}{2}=30$. For the model $y = 26.9x-1.3$, when $x = 2$, $y=26.9\times2 - 1.3=53.8 - 1.3 = 52.5$. When $x = 4$, $y=26.9\times4-1.3 = 107.6-1.3=106.3$. For the model $y = 27x - 4$, when $x = 2$, $y=27\times2-4=54 - 4 = 50$. When $x = 4$, $y=27\times4-4=108 - 4 = 104$.
Step2: Check exponential - form
For an exponential model $y = a(b)^x$. For $y = 47(1.191)^x$, when $x = 2$, $y=47\times(1.191)^2=47\times1.418481\approx66.67$. For $y = 34(1.204)^x$, when $x = 2$, $y=34\times(1.204)^2=34\times1.449616\approx49.29$.
Step3: Analyze the best - fit
We can also note the difference in $y$ - values for consecutive $x$ - values in the data. The differences are: $110 - 50=60$, $160 - 110 = 50$, $210 - 160=50$, $270 - 210 = 60$, $320 - 270=50$. The data seems to follow a linear pattern more closely. Let's use the least - squares method or just check the values more accurately. We know that for a linear model $y=mx + b$, using two - point form to find the equation of the line passing through $(2,50)$ and $(4,110)$: $m = 30$, and substituting $x = 2,y = 50$ into $y=mx + b$ gives $50=30\times2 + b$, so $b=-10$. The closest linear model among the options to our approximated linear relationship is $y = 27x-4$.
Answer:
$y = 27x - 4$