the table shows the height, in meters, of an object that is dropped as time passes until the object hits the…
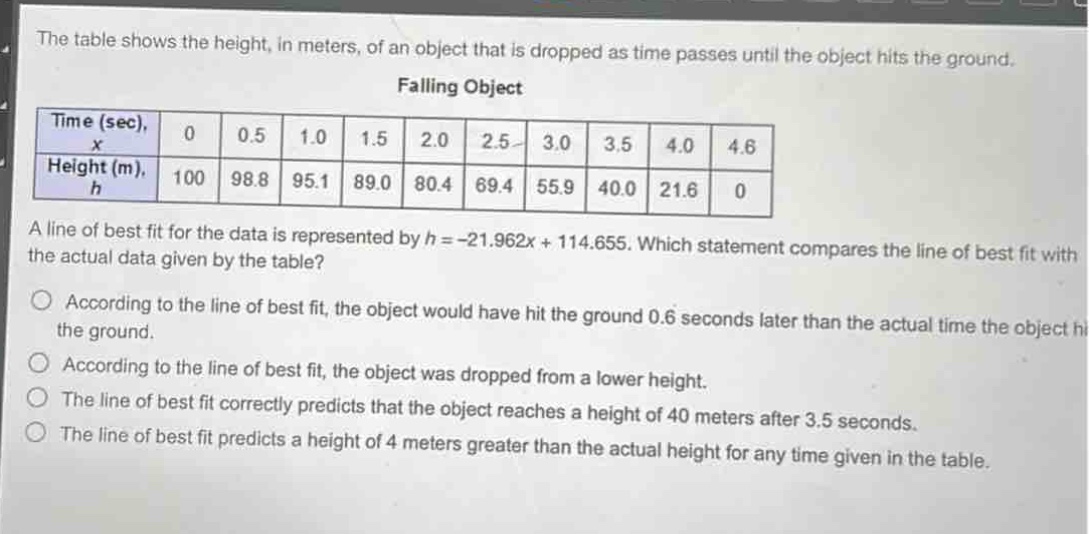
the table shows the height, in meters, of an object that is dropped as time passes until the object hits the ground. falling object\n| time (sec), $x$ | 0 | 0.5 | 1.0 | 1.5 | 2.0 | 2.5 | 3.0 | 3.5 | 4.0 | 4.6 |\n| height (m), $h$ | 100 | 98.8 | 95.1 | 89.0 | 80.4 | 69.4 | 55.9 | 40.0 | 21.6 | 0 |\na line of best fit for the data is represented by $h=-21.962x + 114.655$. which statement compares the line of best fit with the actual data given by the table?\naccording to the line of best fit, the object would have hit the ground 0.6 seconds later than the actual time the object hit the ground.\naccording to the line of best fit, the object was dropped from a lower height.\nthe line of best fit correctly predicts that the object reaches a height of 40 meters after 3.5 seconds.\nthe line of best fit predicts a height of 4 meters greater than the actual height for any time given in the table.
Answer
Explanation:
Step1: Find when the object hits the ground according to the line - of - best - fit
Set $h = 0$ in the equation $h=-21.962x + 114.655$. Then $0=-21.962x + 114.655$. Solving for $x$ gives $x=\frac{114.655}{21.962}\approx5.22$ seconds. From the table, the object hits the ground at $x = 4.6$ seconds. The difference is $5.22−4.6 = 0.62\approx0.6$ seconds.
Step2: Check the initial height according to the line - of - best - fit
When $x = 0$, $h=-21.962\times0 + 114.655=114.655$ meters. From the table, the initial height is $100$ meters. So the object was dropped from a higher height according to the line - of - best - fit.
Step3: Check the height at $x = 3.5$ seconds
For the line - of - best - fit, when $x = 3.5$, $h=-21.962\times3.5+114.655=-76.867 + 114.655 = 37.788$ meters. From the table, at $x = 3.5$ seconds, $h = 40$ meters.
Step4: Analyze the general prediction
We have seen that at $x = 3.5$ seconds, the line - of - best - fit predicts a lower height than the actual height.
Answer:
According to the line of best fit, the object would have hit the ground 0.6 seconds later than the actual time the object hit the ground.