the table shows the maze - completion times, in seconds, of two sets of mice in an experiment. maze…
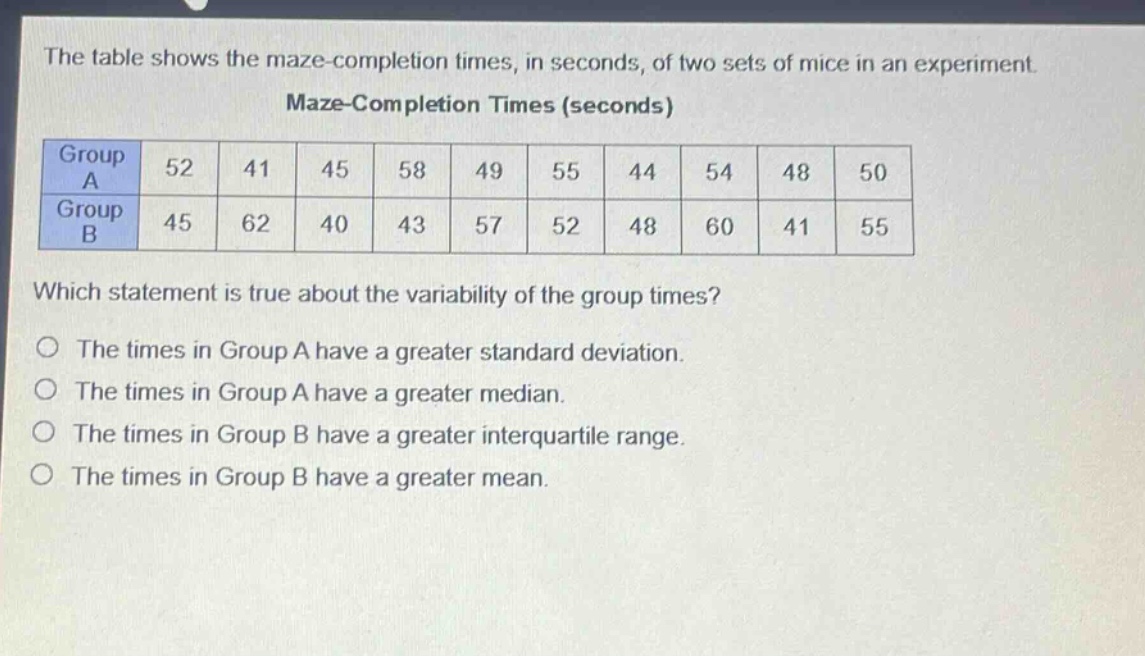
the table shows the maze - completion times, in seconds, of two sets of mice in an experiment. maze - completion times (seconds) group a 52 41 45 58 49 55 44 54 48 50 group b 45 62 40 43 57 52 48 60 41 55 which statement is true about the variability of the group times? the times in group a have a greater standard deviation. the times in group a have a greater median. the times in group b have a greater interquartile range. the times in group b have a greater mean.
Answer
Explanation:
Step1: Calculate mean of Group A
$\bar{x}_A=\frac{52 + 41+45 + 58+49+55+44+54+48+50}{10}=\frac{496}{10} = 49.6$
Step2: Calculate mean of Group B
$\bar{x}_B=\frac{45+62 + 40+43+57+52+48+60+41+55}{10}=\frac{503}{10}=50.3$
Step3: Arrange data of Group A in ascending - order
$41,44,45,48,49,50,52,54,55,58$ Median of Group A: $\frac{49 + 50}{2}=49.5$
Step4: Arrange data of Group B in ascending - order
$40,41,43,45,48,52,55,57,60,62$ Median of Group B: $\frac{48 + 52}{2}=50$
Step5: Calculate inter - quartile range of Group A
$Q_1$ of Group A is the median of the lower half: $\frac{44+45}{2}=44.5$ $Q_3$ of Group A is the median of the upper half: $\frac{54 + 55}{2}=54.5$ $IQR_A=Q_3 - Q_1=54.5 - 44.5 = 10$
Step6: Calculate inter - quartile range of Group B
$Q_1$ of Group B is the median of the lower half: $\frac{41+43}{2}=42$ $Q_3$ of Group B is the median of the upper half: $\frac{57+60}{2}=58.5$ $IQR_B=Q_3 - Q_1=58.5 - 42 = 16.5$
Step7: Analyze standard deviation conceptually (without full calculation)
By observing the data, Group B has more spread - out values (more extreme values like 40 and 62) compared to Group A, so Group B likely has a greater standard deviation.
Since $IQR_B = 16.5$ and $IQR_A=10$, Group B has a greater inter - quartile range.
Answer:
The times in Group B have a greater interquartile range.