the table shows the mean and mean absolute deviation for these samples. complete the paragraph. if the…
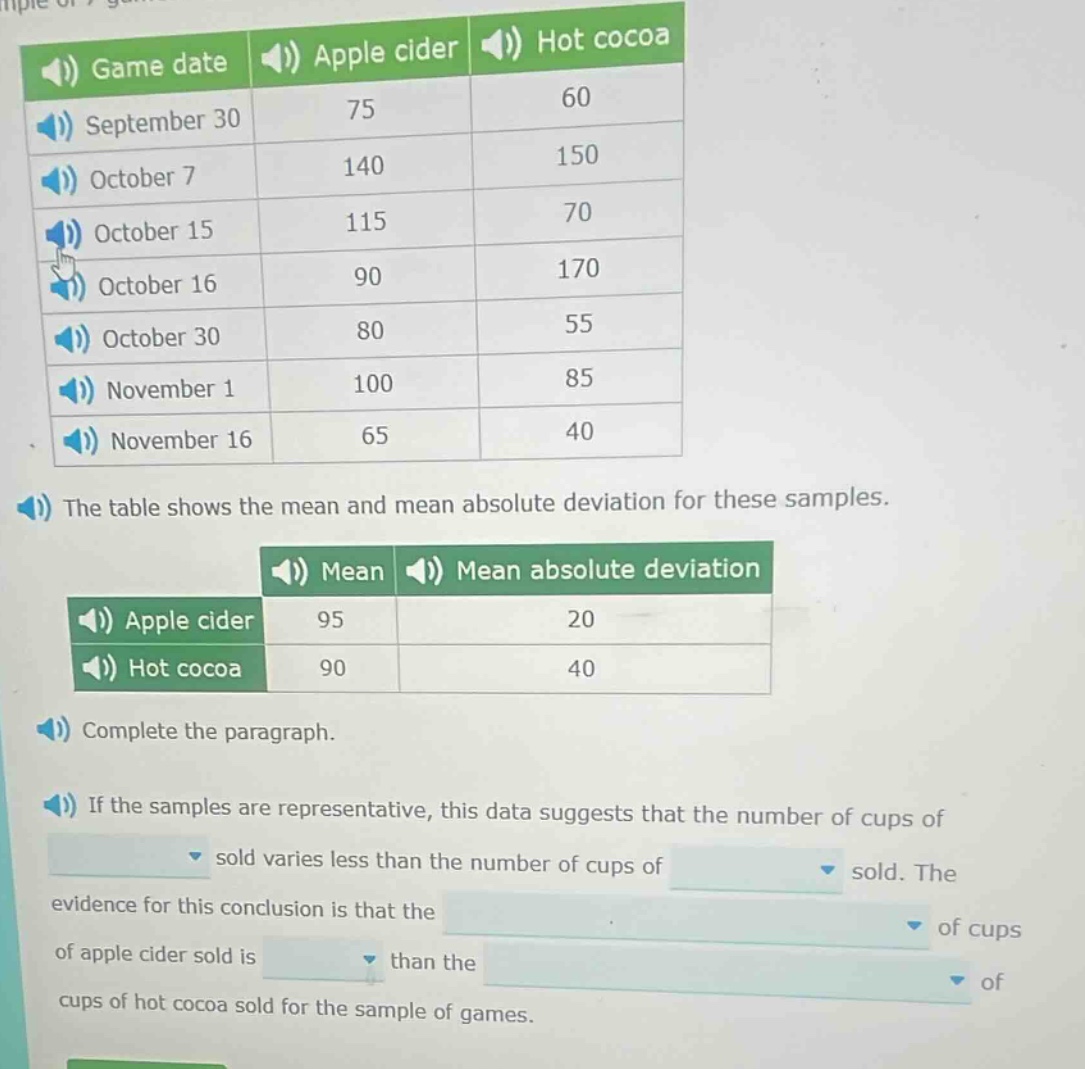
the table shows the mean and mean absolute deviation for these samples. complete the paragraph. if the samples are representative, this data suggests that the number of cups of sold varies less than the number of cups of sold. the evidence for this conclusion is that the of cups of apple cider sold is than the of cups of hot cocoa sold for the sample of games.
Answer
Explanation:
Step1: Recall the concept of mean - absolute - deviation
The mean absolute deviation (MAD) measures the variability or spread of a data - set. A smaller MAD indicates less variability in the data.
Step2: Compare the MADs of apple cider and hot cocoa
The MAD of apple cider is 20 and the MAD of hot cocoa is 40. Since 20 < 40.
Answer:
If the samples are representative, this data suggests that the number of cups of apple cider sold varies less than the number of cups of hot cocoa sold. The evidence for this conclusion is that the mean absolute deviation of cups of apple cider sold is less than the mean absolute deviation of cups of hot cocoa sold for the sample of games.