which table shows a negative correlation? x 2 5 6 7 10 12 y -8 -5 -6 -3 -2 -1 x 2 5 6 7 10 12 y -5 -5 -5 -5…
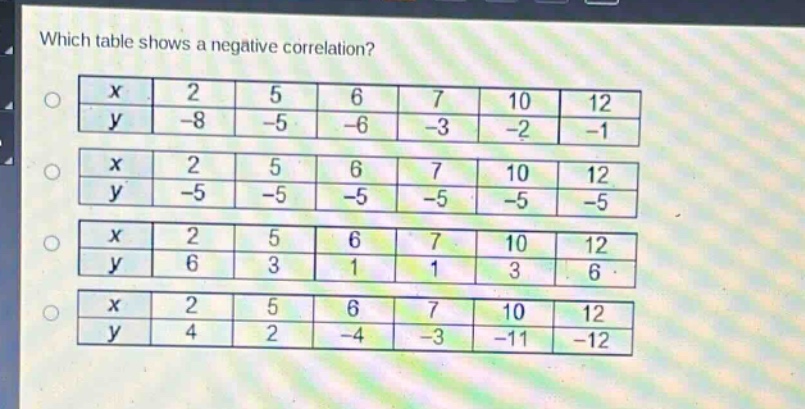
which table shows a negative correlation? x 2 5 6 7 10 12 y -8 -5 -6 -3 -2 -1 x 2 5 6 7 10 12 y -5 -5 -5 -5 -5 -5 x 2 5 6 7 10 12 y 6 3 1 1 3 6 x 2 5 6 7 10 12 y 4 2 -4 -3 -11 -12
Answer
Explanation:
Step1: Recall negative - correlation concept
In a negative correlation, as the value of $x$ increases, the value of $y$ decreases.
Step2: Analyze the first table
When $x$ increases from 2 to 5, $y$ increases from - 8 to - 5, so it's not a negative correlation.
Step3: Analyze the second table
$y$ is constant (-5) for all values of $x$, so there is no correlation.
Step4: Analyze the third table
The values of $y$ do not consistently decrease as $x$ increases, so it's not a negative correlation.
Step5: Analyze the fourth table
As $x$ increases from 2 to 5 to 6 to 7 to 10 to 12, $y$ decreases from 4 to 2 to - 4 to - 3 to - 11 to - 12, showing a negative correlation.
Answer:
The fourth table (where $x$ values are 2, 5, 6, 7, 10, 12 and $y$ values are 4, 2, - 4, - 3, - 11, - 12) shows a negative correlation.