which table shows negative correlation?\n| x | y |\n|----|----|\n| 1 | 19 |\n| 2 | 12 |\n| 3 | 10 |\n| 4 |…
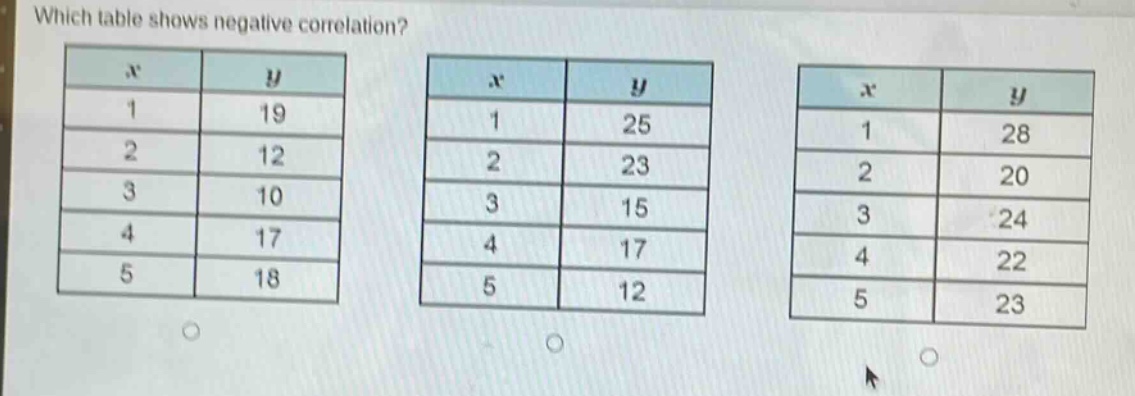
which table shows negative correlation?\n| x | y |\n|----|----|\n| 1 | 19 |\n| 2 | 12 |\n| 3 | 10 |\n| 4 | 17 |\n| 5 | 18 |\n| x | y |\n|----|----|\n| 1 | 25 |\n| 2 | 23 |\n| 3 | 15 |\n| 4 | 17 |\n| 5 | 12 |\n| x | y |\n|----|----|\n| 1 | 28 |\n| 2 | 20 |\n| 3 | 24 |\n| 4 | 22 |\n| 5 | 23 |
Answer
Explanation:
Step1: Recall negative - correlation concept
In a negative - correlation, as the value of (x) increases, the value of (y) generally decreases.
Step2: Analyze the first table
For the first table: when (x) increases from 1 to 2, (y) decreases from 19 to 12, but when (x) increases from 3 to 4, (y) increases from 10 to 17, so it does not show a consistent negative correlation.
Step3: Analyze the second table
For the second table: as (x) increases from 1 to 2, (y) decreases from 25 to 23, as (x) increases from 2 to 3, (y) decreases from 23 to 15, as (x) increases from 3 to 4, (y) decreases from 15 to 17 (a small deviation), and as (x) increases from 4 to 5, (y) decreases from 17 to 12. Overall, as (x) increases, (y) generally decreases, showing a negative correlation.
Step4: Analyze the third table
For the third table: when (x) increases from 1 to 2, (y) decreases from 28 to 20, but when (x) increases from 2 to 3, (y) increases from 20 to 24, so it does not show a consistent negative correlation.