the table shows the number of hours spent studying for a history final exam and the score on that exam. each…
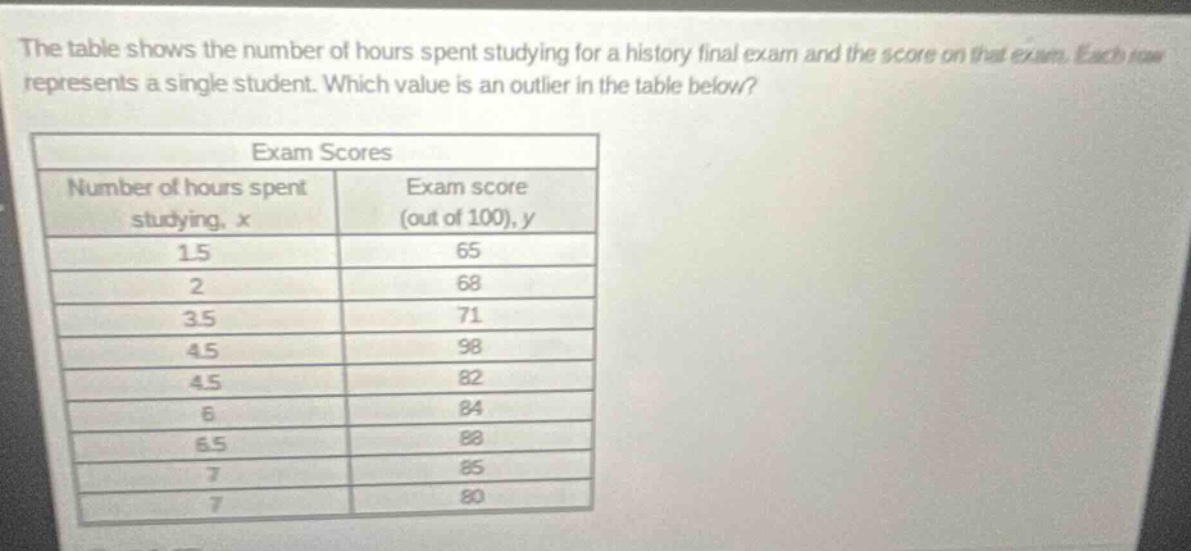
the table shows the number of hours spent studying for a history final exam and the score on that exam. each row represents a single student. which value is an outlier in the table below? exam scores number of hours spent studying, x exam score (out of 100), y 1.5 65 2 68 3.5 71 4.5 98 4.5 82 6 84 6.5 88 7 85 7 80
Answer
Explanation:
Step1: Observe the data trend
As the number of hours studying increases, the exam - score generally increases. For most data points, when the number of hours is around 4.5 - 7, the scores are in the range of 80 - 88.
Step2: Identify the outlier
The data point (4.5, 98) has a score that is much higher than what would be expected based on the general trend of the other data points.
Answer:
(4.5, 98)