the table shows the number of wins of two high school softball teams over the past ten years. which…
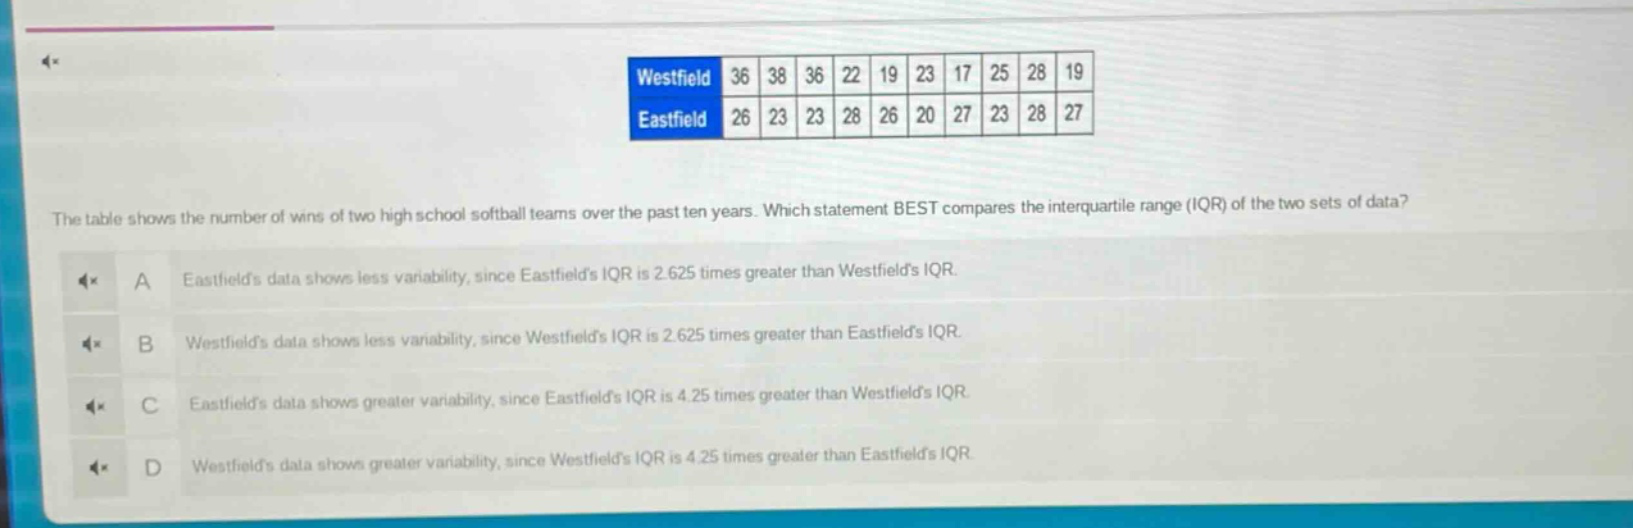
the table shows the number of wins of two high school softball teams over the past ten years. which statement best compares the interquartile range (iqr) of the two sets of data? a eastfields data shows less variability, since eastfields iqr is 2.625 times greater than westfields iqr. b westfields data shows less variability, since westfields iqr is 2.625 times greater than eastfields iqr. c eastfields data shows greater variability, since eastfields iqr is 4.25 times greater than westfields iqr. d westfields data shows greater variability, since westfields iqr is 4.25 times greater than eastfields iqr.
Answer
Explanation:
Step1: Arrange West - field data in ascending order
17, 19, 19, 22, 23, 25, 28, 36, 36, 38
Step2: Find the median of West - field data
Since (n = 10) (even), median (Q_2=\frac{23 + 25}{2}=24)
Step3: Find the lower half and upper half of West - field data
Lower half: 17, 19, 19, 22, 23; Upper half: 25, 28, 36, 36, 38
Step4: Find (Q_1) and (Q_3) for West - field data
(Q_1) (median of lower half) ( = 19), (Q_3) (median of upper half) (=36), (IQR_{Westfield}=Q_3 - Q_1=36 - 19 = 17)
Step5: Arrange East - field data in ascending order
20, 23, 23, 23, 26, 26, 27, 27, 28, 28
Step6: Find the median of East - field data
Since (n = 10) (even), median (Q_2=\frac{26+26}{2}=26)
Step7: Find the lower half and upper half of East - field data
Lower half: 20, 23, 23, 23, 26; Upper half: 26, 27, 27, 28, 28
Step8: Find (Q_1) and (Q_3) for East - field data
(Q_1) (median of lower half) ( = 23), (Q_3) (median of upper half) (=27), (IQR_{Eastfield}=Q_3 - Q_1=27 - 23 = 4)
Step9: Compare the IQRs
(\frac{IQR_{Westfield}}{IQR_{Eastfield}}=\frac{17}{4}=4.25)
Answer:
D. Westfield's data shows greater variability, since Westfield's IQR is 4.25 times greater than Eastfield's IQR