the table shows the population of center city in various years. use the data from 1990 and 2005 to create a…
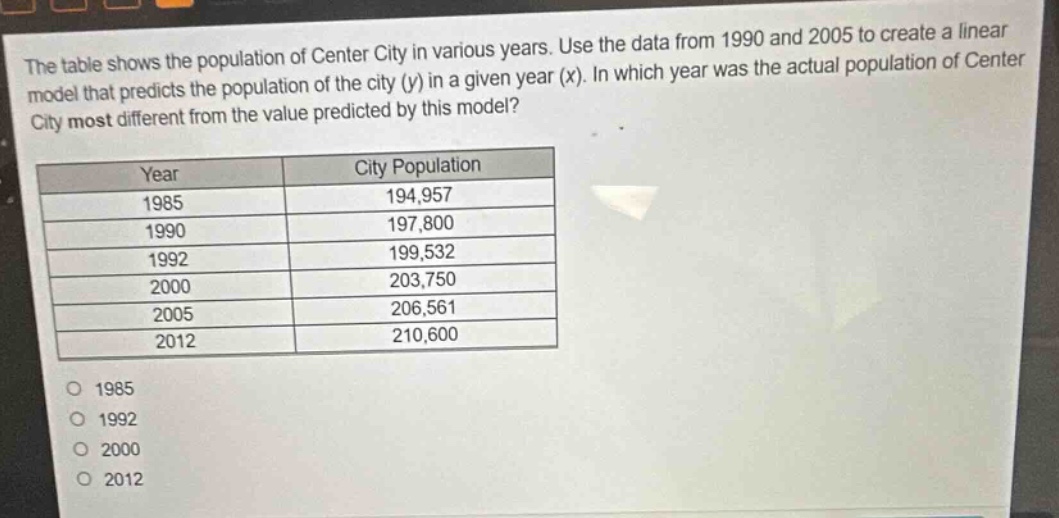
the table shows the population of center city in various years. use the data from 1990 and 2005 to create a linear model that predicts the population of the city (y) in a given year (x). in which year was the actual population of center city most different from the value predicted by this model?\n\n| year | city population |\n| ---- | ---- |\n| 1985 | 194,957 |\n| 1990 | 197,800 |\n| 1992 | 199,532 |\n| 2000 | 203,750 |\n| 2005 | 206,561 |\n| 2012 | 210,600 |\n\n1985\n1992\n2000\n2012
Answer
Explanation:
Step1: Define variables
Let $x$ be the year and $y$ be the population. Let $x = 0$ correspond to 1990, so for 1990, $x_1=0$ and $y_1 = 197800$, for 2005, $x_2=2005 - 1990=15$ and $y_2 = 206561$.
Step2: Find the slope of the line
The slope $m$ of the line is given by the formula $m=\frac{y_2 - y_1}{x_2 - x_1}$. Substituting the values, we have $m=\frac{206561 - 197800}{15}=\frac{8761}{15}\approx584.07$.
Step3: Find the y - intercept
The equation of a line is $y=mx + b$. Since $x = 0$ at 1990 and $y=197800$, the y - intercept $b = 197800$. So the linear model is $y=584.07x+197800$.
Step4: Calculate predicted values for each year
For 1985 ($x=- 5$): $y=584.07\times(-5)+197800=-2920.35 + 197800=194879.65$. The difference from the actual value is $|194957 - 194879.65|=77.35$. For 1992 ($x = 2$): $y=584.07\times2+197800=1168.14+197800=198968.14$. The difference from the actual value is $|199532 - 198968.14| = 563.86$. For 2000 ($x = 10$): $y=584.07\times10+197800=5840.7+197800=203640.7$. The difference from the actual value is $|203750 - 203640.7|=109.3$. For 2012 ($x = 22$): $y=584.07\times22+197800=12849.54+197800=210649.54$. The difference from the actual value is $|210600 - 210649.54|=49.54$.
Answer:
1992