which table shows a positive correlation?\n| x | y |\n|----|----|\n| 1 | 5 |\n| 2 | 5 |\n| 2 | 5 |\n| 4 | 5…
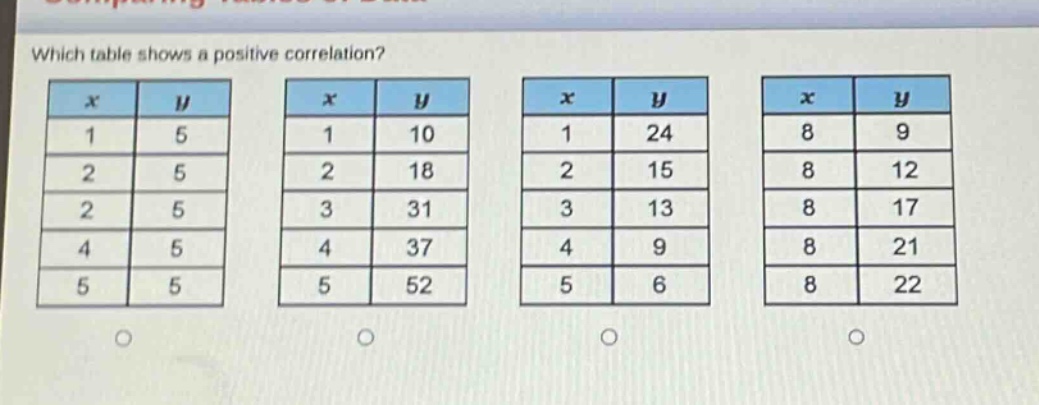
which table shows a positive correlation?\n| x | y |\n|----|----|\n| 1 | 5 |\n| 2 | 5 |\n| 2 | 5 |\n| 4 | 5 |\n| 5 | 5 |\n| x | y |\n|----|----|\n| 1 | 10 |\n| 2 | 18 |\n| 3 | 31 |\n| 4 | 37 |\n| 5 | 52 |\n| x | y |\n|----|----|\n| 1 | 24 |\n| 2 | 15 |\n| 3 | 13 |\n| 4 | 9 |\n| 5 | 6 |\n| x | y |\n|----|----|\n| 8 | 9 |\n| 8 | 12 |\n| 8 | 17 |\n| 8 | 21 |\n| 8 | 22 |
Answer
Answer:
The second table (with values (x = 1,y = 10;x = 2,y = 18;x = 3,y = 31;x = 4,y = 37;x = 5,y = 52))
Explanation:
Step1: Define positive correlation
Positive correlation means as (x) increases, (y) generally increases.
Step2: Analyze first table
For (x) values (1,2,2,4,5), (y) is constantly (5). No positive - correlation.
Step3: Analyze second table
As (x) goes from (1) to (2) to (3) to (4) to (5), (y) goes from (10) to (18) to (31) to (37) to (52), showing an upward trend.
Step4: Analyze third table
As (x) increases from (1) to (2) to (3) to (4) to (5), (y) decreases from (24) to (15) to (13) to (9) to (6). Negative - correlation.
Step5: Analyze fourth table
(x) is constantly (8), and (y) changes. No correlation with respect to (x) increasing.