the table shows the relationship between the age of a person, x, and how many hours of television they watch…
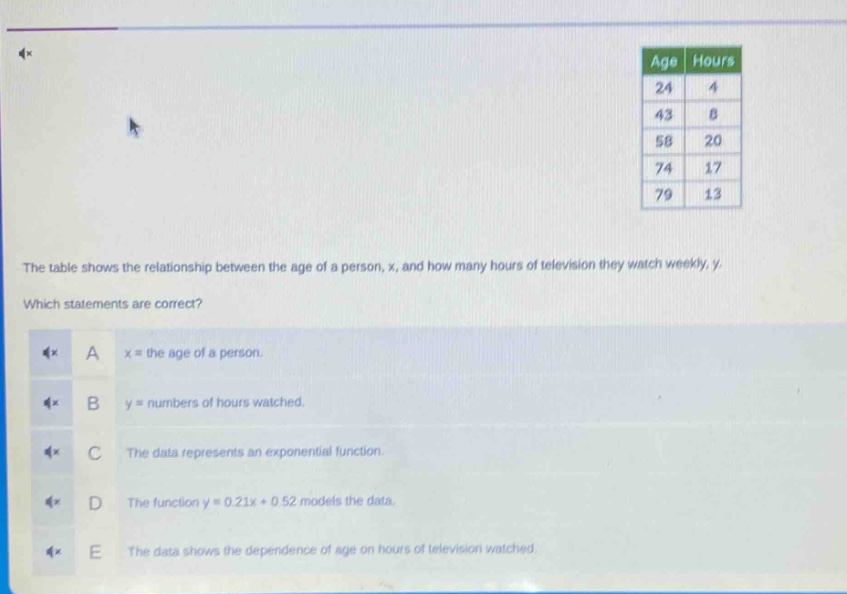
the table shows the relationship between the age of a person, x, and how many hours of television they watch weekly, y. which statements are correct? a x = the age of a person. b y = numbers of hours watched. c the data represents an exponential function. d the function y = 0.21x + 0.52 models the data. e the data shows the dependence of age on hours of television watched.
Answer
Explanation:
Step1: Analyze variable definitions
The problem states that (x) is the age of a person and (y) is the number of hours of television watched weekly. So, statements A and B are correct based on the problem - setup.
Step2: Check function type
To check if it's an exponential function, we would expect a pattern like (y = a\cdot b^{x}). Looking at the data points ((24,4),(43,8),(58,20),(74,17),(79,13)), there is no clear exponential - growth or decay pattern. So, statement C is incorrect.
Step3: Check linear model
We can use a linear regression method (or just check by substituting points) to see if (y = 0.21x+0.52) models the data. For (x = 24), (y=0.21\times24 + 0.52=5.04+0.52 = 5.56\neq4). So, statement D is incorrect.
Step4: Analyze dependence
The data shows the dependence of the number of hours of television watched ((y)) on the age of a person ((x)), not the other way around. So, statement E is incorrect.
Answer:
A. (x =) the age of a person. B. (y=) numbers of hours watched.