the table below shows the relationship between quiz scores and study time (in hours) for each student in…
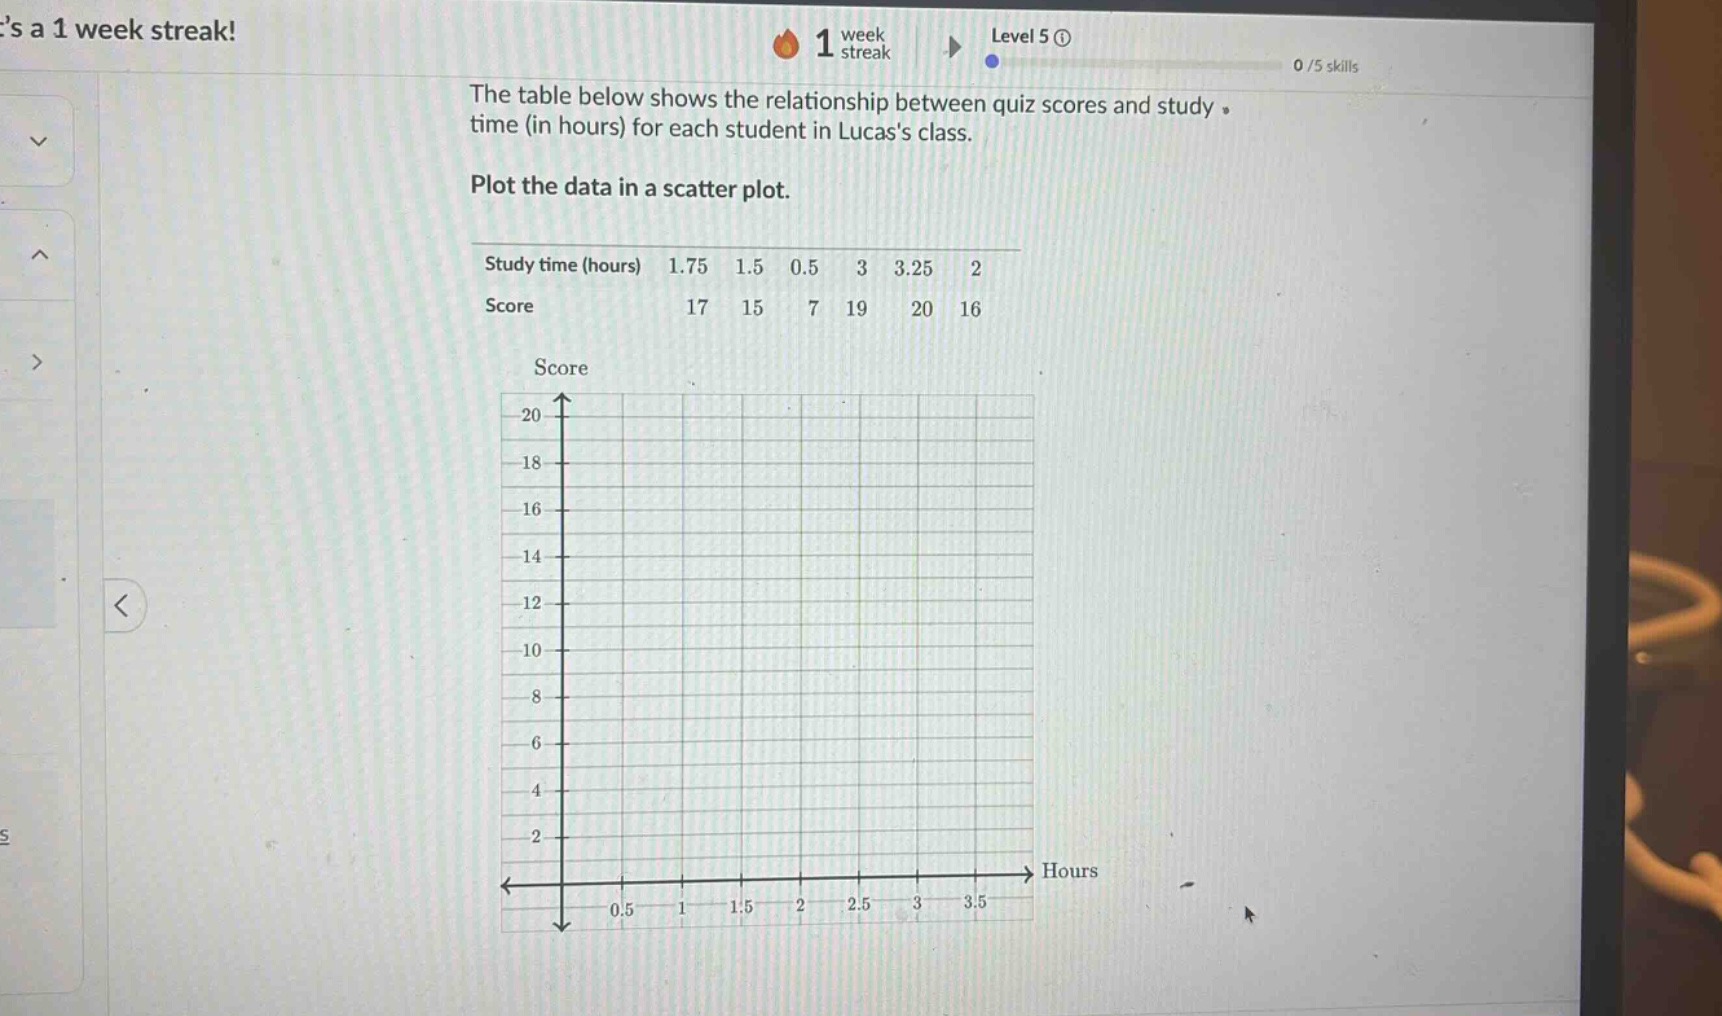
the table below shows the relationship between quiz scores and study time (in hours) for each student in lucass class. plot the data in a scatter plot. study time (hours) 1.75 1.5 0.5 3 3.25 2 score 17 15 7 19 20 16 score 20 18 16 14 12 10 8 6 4 2 hours 0.5 1 1.5 2 2.5 3 3.5
Answer
Explanation:
Step1: Identify data - points
We have pairs: (1.75, 17), (1.5, 15), (0.5, 7), (3, 19), (3.25, 20), (2, 16)
Step2: Locate on scatter - plot
On the x - axis (Hours) mark the study - time values and on the y - axis (Score) mark the corresponding score values for each pair and place a dot at the intersection for each pair.
Answer:
A scatter - plot with points placed at (1.75, 17), (1.5, 15), (0.5, 7), (3, 19), (3.25, 20), (2, 16) on the given grid.