the table shows the relationship between students gpa and their achievement motivation. if the outlier is…
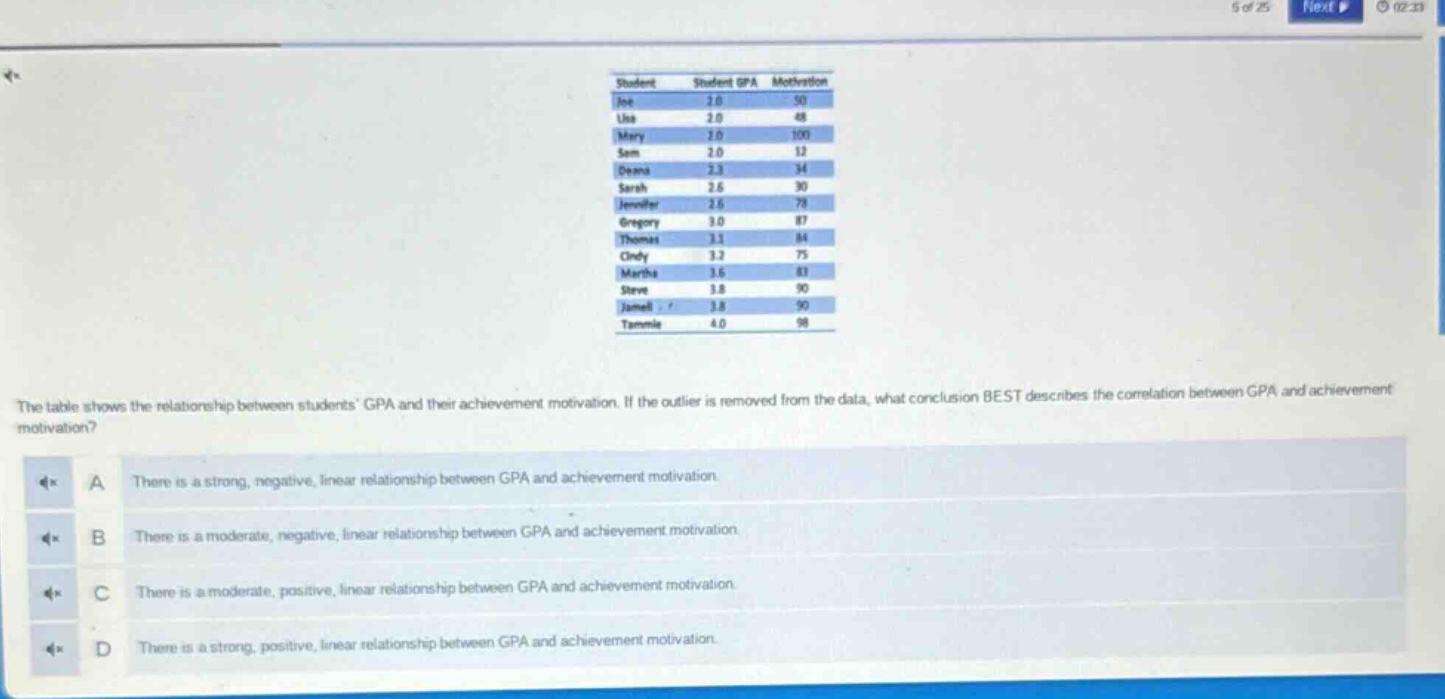
the table shows the relationship between students gpa and their achievement motivation. if the outlier is removed from the data, what conclusion best describes the correlation between gpa and achievement motivation? a there is a strong, negative, linear relationship between gpa and achievement motivation. b there is a moderate, negative, linear relationship between gpa and achievement motivation. c there is a moderate, positive, linear relationship between gpa and achievement motivation. d there is a strong, positive, linear relationship between gpa and achievement motivation.
Answer
Answer:
C. There is a moderate, positive, linear relationship between GPA and achievement motivation.
Explanation:
Step1: Identify the outlier
By observing the data, Mary with GPA = 1.0 and motivation = 100 seems to be an outlier as her motivation is very high compared to her low - GPA while others have more in - line values.
Step2: Analyze the remaining data trend
After removing Mary, as GPA increases, motivation also generally increases. For example, from Joe (GPA = 2.0, motivation = 50) to Tammie (GPA = 4.0, motivation = 98). The relationship is not extremely strong but shows a positive trend, indicating a moderate, positive, linear relationship.