the table shows the relationship between time spent running and distance traveled.\nrunning distance over…
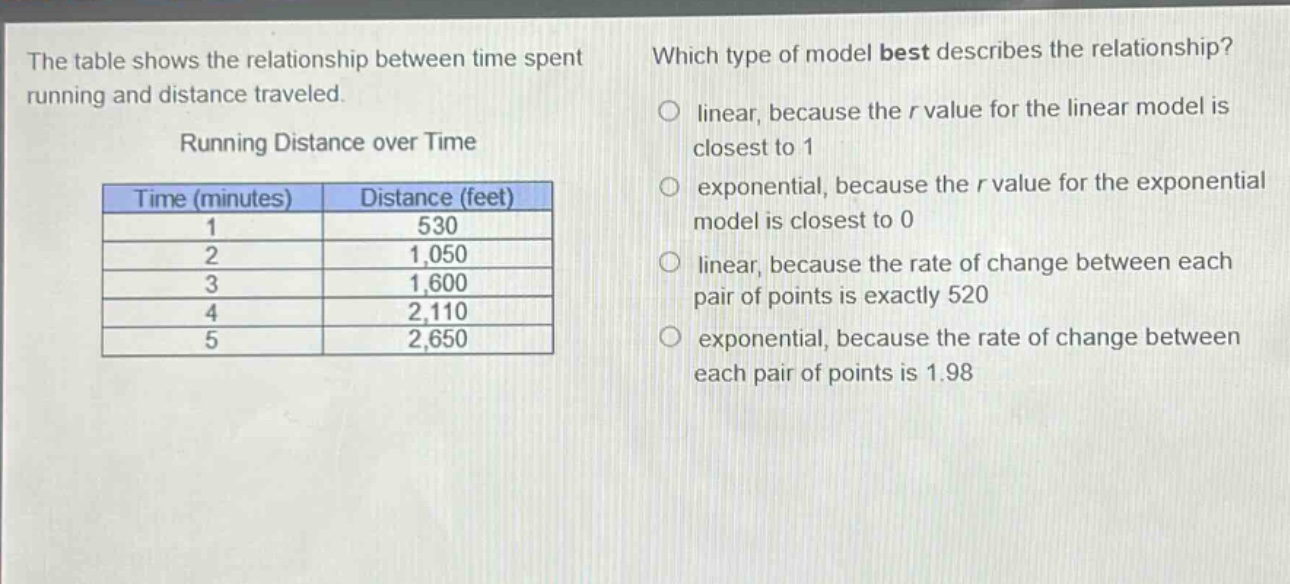
the table shows the relationship between time spent running and distance traveled.\nrunning distance over time\n| time (minutes) | distance (feet) |\n| ---- | ---- |\n| 1 | 530 |\n| 2 | 1,050 |\n| 3 | 1,600 |\n| 4 | 2,110 |\n| 5 | 2,650 |\nwhich type of model best describes the relationship?\no linear, because the r - value for the linear model is closest to 1\no exponential, because the r - value for the exponential model is closest to 0\no linear, because the rate of change between each pair of points is exactly 520\no exponential, because the rate of change between each pair of points is 1.98
Answer
Explanation:
Step1: Calculate the rate of change
For a linear relationship, the rate of change (slope) between two - points $(x_1,y_1)$ and $(x_2,y_2)$ is given by $m=\frac{y_2 - y_1}{x_2 - x_1}$. For $(x_1 = 1,y_1 = 530)$ and $(x_2 = 2,y_2 = 1050)$: $m_1=\frac{1050 - 530}{2 - 1}=520$. For $(x_1 = 2,y_1 = 1050)$ and $(x_2 = 3,y_2 = 1600)$: $m_2=\frac{1600 - 1050}{3 - 2}=550$. For $(x_1 = 3,y_1 = 1600)$ and $(x_2 = 4,y_2 = 2110)$: $m_3=\frac{2110 - 1600}{4 - 3}=510$. For $(x_1 = 4,y_1 = 2110)$ and $(x_2 = 5,y_2 = 2650)$: $m_4=\frac{2650 - 2110}{5 - 4}=540$. The average rate of change is approximately constant. Also, a linear model is appropriate when the rate of change between points is relatively constant. And the $r -$ value (correlation coefficient) for a linear model being close to 1 indicates a strong linear relationship.
Step2: Analyze the options
The first option says linear because the $r$ value for the linear model is closest to 1. This is a correct way to determine a linear relationship as a correlation coefficient $r$ close to 1 (or - 1) in a linear regression model implies a strong linear association. The second option is incorrect because an $r$ - value close to 0 for an exponential model indicates a poor fit for an exponential relationship. The third option is incorrect because the rate of change between each pair of points is not exactly 520. The fourth option is incorrect because the relationship is not exponential as the rate of change is not a constant multiplier (1.98 is not correct for all pairs).
Answer:
linear, because the $r$ value for the linear model is closest to 1