the table shows the relationship between time spent running and distance traveled. running distance over…
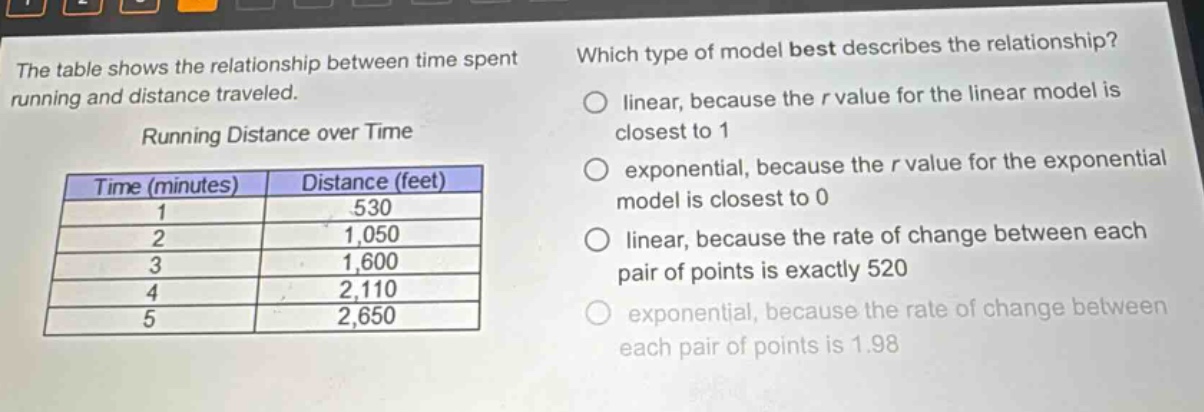
the table shows the relationship between time spent running and distance traveled. running distance over time time (minutes) distance (feet) 1 530 2 1,050 3 1,600 4 2,110 5 2,650 which type of model best describes the relationship? linear, because the r value for the linear model is closest to 1 exponential, because the r value for the exponential model is closest to 0 linear, because the rate of change between each pair of points is exactly 520 exponential, because the rate of change between each pair of points is 1.98
Answer
Explanation:
Step1: Calculate rate - of - change
For a linear model, the rate of change (slope) between two points $(x_1,y_1)$ and $(x_2,y_2)$ is $m=\frac{y_2 - y_1}{x_2 - x_1}$. For $(x_1 = 1,y_1=530)$ and $(x_2 = 2,y_2 = 1050)$, $m_1=\frac{1050 - 530}{2 - 1}=520$. For $(x_1 = 2,y_1 = 1050)$ and $(x_2 = 3,y_2 = 1600)$, $m_2=\frac{1600 - 1050}{3 - 2}=550$. Since the rate of change is not exactly 520 for all pairs of points, we can rule out the option about a linear model with a constant rate - of - change of 520. For an exponential model $y = ab^x$, the ratio of consecutive $y$ - values gives the common ratio. $\frac{1050}{530}\approx1.98$, $\frac{1600}{1050}\approx1.52$, since the ratio is not constant, we can rule out the exponential model options. The correlation coefficient $r$ measures the strength and direction of a linear relationship. A value of $r$ close to 1 indicates a strong positive linear relationship. If the $r$ - value for the linear model is closest to 1, it means the linear model best fits the data.
Answer:
linear, because the $r$ value for the linear model is closest to 1