the table shows the relationship between time spent running and distance traveled.\nrunning distance over…
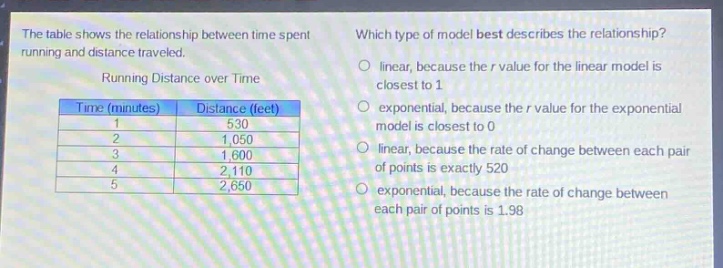
the table shows the relationship between time spent running and distance traveled.\nrunning distance over time\n| time (minutes) | distance (feet) |\n| ---- | ---- |\n| 1 | 530 |\n| 2 | 1,050 |\n| 3 | 1,600 |\n| 4 | 2,110 |\n| 5 | 2,650 |\nwhich type of model best describes the relationship?\nlinear, because the r value for the linear model is closest to 1\nexponential, because the r value for the exponential model is closest to 0\nlinear, because the rate of change between each pair of points is exactly 520\nexponential, because the rate of change between each pair of points is 1.98
Answer
Explanation:
Step1: Calculate rate of change
To check if it's linear, find the difference in distance for each unit - increase in time. For (t = 1) to (t = 2): (1050 - 530=520) For (t = 2) to (t = 3): (1600 - 1050 = 550) For (t = 3) to (t = 4): (2110 - 1600=510) For (t = 4) to (t = 5): (2660 - 2110 = 550) The rate of change is not exactly constant, but it is approximately constant.
Step2: Recall model - selection criteria
The (r) - value (correlation coefficient) measures the strength and direction of a linear relationship. A value of (r) close to 1 indicates a strong positive linear relationship. In the absence of information about (r) - values for exponential models, and since the rate of change between points is approximately constant, a linear model is more appropriate.
Answer:
linear, because the rate of change between each pair of points is approximately constant (and the best - fitting linear model would likely have an (r) value closest to 1 compared to an exponential model)