2. the table shows the results of asking a group of teachers the question how many students are in your…
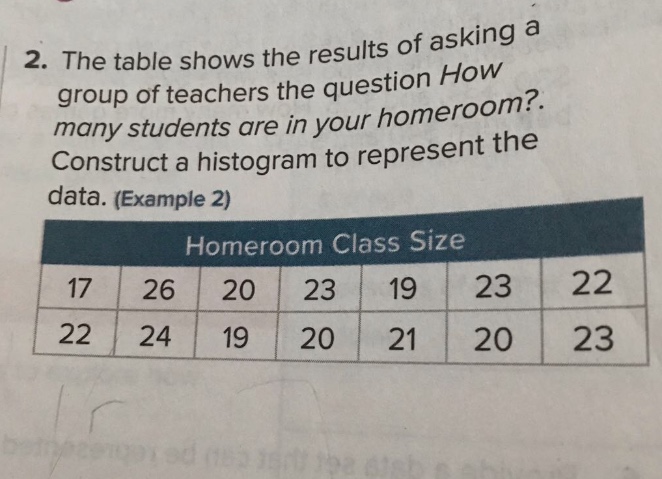
2. the table shows the results of asking a group of teachers the question how many students are in your homeroom? construct a histogram to represent the data. (example 2)\nhomeroom class size\n17 26 20 23 19 23 22\n22 24 19 20 21 20 23
Answer
Explanation:
Step1: Determine class intervals
Let's use class intervals of width 5 starting from 15 - 19, 20 - 24, 25 - 29 etc.
Step2: Count the frequencies
For the interval 15 - 19: The values 17, 19, 19 fall in this interval. Frequency = 3. For the interval 20 - 24: The values 26, 20, 23, 22, 22, 24, 20, 21, 20, 23 fall in this interval. Frequency = 10. For the interval 25 - 29: The value 26 falls in this interval. Frequency = 1.
Step3: Draw the histogram
On the x - axis, label the class intervals (15 - 19, 20 - 24, 25 - 29). On the y - axis, label the frequency. Draw bars with heights corresponding to the frequencies for each class interval.
Answer:
A histogram with class intervals 15 - 19, 20 - 24, 25 - 29 having frequencies 3, 10, 1 respectively.