the table shows the results of a survey of 200 randomly selected people on whether they like watermelon…
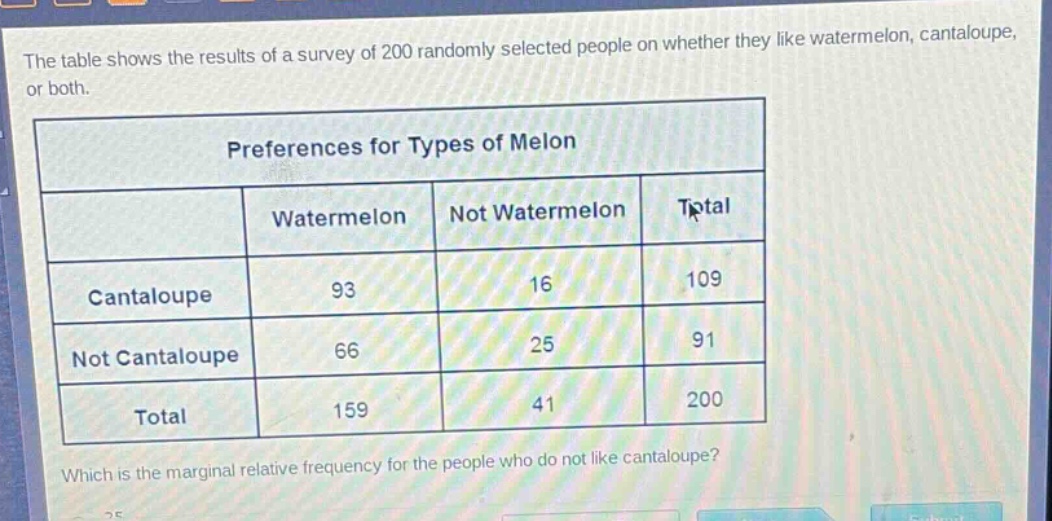
the table shows the results of a survey of 200 randomly selected people on whether they like watermelon, cantaloupe, or both.\npreferences for types of melon\n| |watermelon|not watermelon|total|\n|--|--|--|--|\n|cantaloupe|93|16|109|\n|not cantaloupe|66|25|91|\n|total|159|41|200|\nwhich is the marginal relative frequency for the people who do not like cantaloupe?
Answer
Explanation:
Step1: Recall marginal relative frequency formula
Marginal relative frequency = $\frac{\text{Row/Column total}}{\text{Grand total}}$
Step2: Identify relevant values
The number of people who do not like cantaloupe (row - total) is 91, and the grand total of people surveyed is 200.
Step3: Calculate marginal relative frequency
Marginal relative frequency = $\frac{91}{200}= 0.455$
Answer:
$0.455$