the table shows the shoe sizes of women of different ages. which best describes the strength of the model…
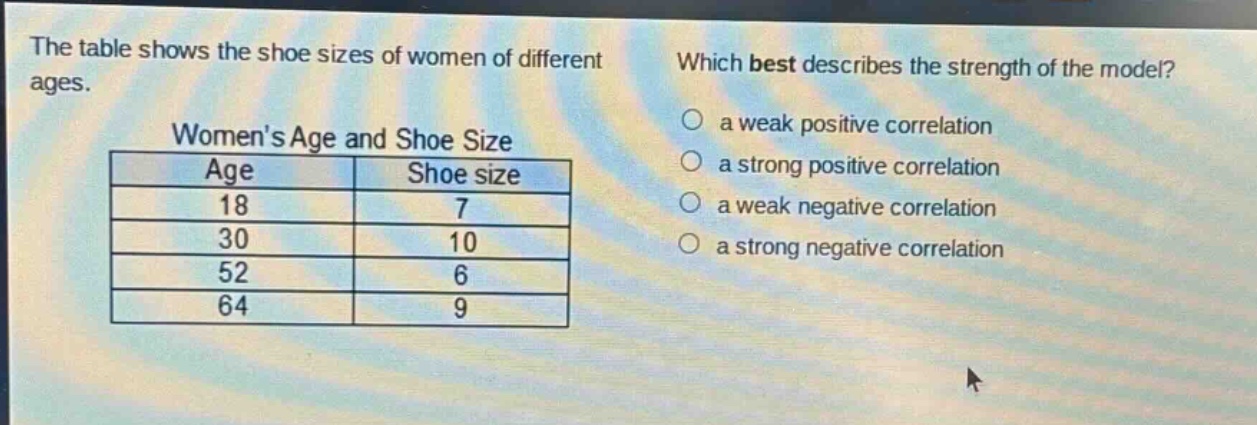
the table shows the shoe sizes of women of different ages. which best describes the strength of the model? womens age and shoe size\n| age | shoe size |\n| ---- | ---- |\n| 18 | 7 |\n| 30 | 10 |\n| 52 | 6 |\n| 64 | 9 |\n a weak positive correlation\n a strong positive correlation\n a weak negative correlation\n a strong negative correlation
Answer
Answer:
a weak positive correlation
Explanation:
Step1: Observe data trend
As age increases from 18 - 30, shoe - size increases from 7 - 10. Then from 30 - 52, shoe - size decreases from 10 - 6, and from 52 - 64, it increases from 6 - 9. Overall, there is a general upward trend but with fluctuations.
Step2: Determine correlation type
Since the general trend is that as age increases, shoe - size has a tendency to increase, it is a positive correlation. And due to the fluctuations, it is not a strong positive correlation, so it is a weak positive correlation.