the table shows the time a patient spends at the dentist and the amount of the bill. what is the correlation…
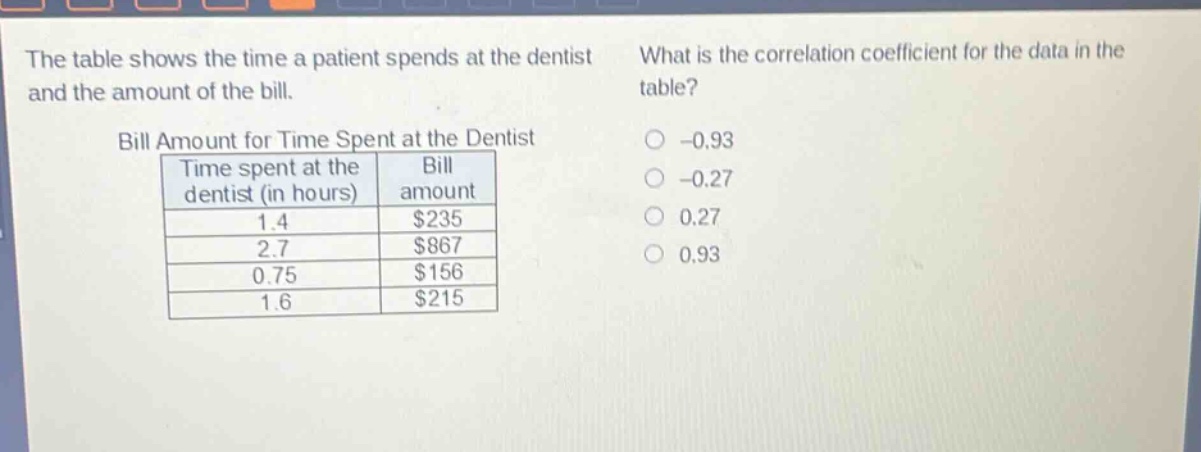
the table shows the time a patient spends at the dentist and the amount of the bill. what is the correlation coefficient for the data in the table? bill amount for time spent at the dentist\n| time spent at the dentist (in hours) | bill amount |\n| ---- | ---- |\n| 1.4 | $235 |\n| 2.7 | $867 |\n| 0.75 | $156 |\n| 1.6 | $215 |\n-0.93\n-0.27\n0.27\n0.93
Answer
Answer:
D. 0.93
Explanation:
Step1: Observe data trend
As time increases, bill amount increases.
Step2: Recall correlation coefficient
Positive correlation for increasing - trend data.
Step3: Analyze options
Options A and B are negative. Option C is weak positive. Option D is strong positive which fits increasing - trend well.