the table below shows the times (in seconds) of all finishers in the finals of the mens 100 - meter race in…
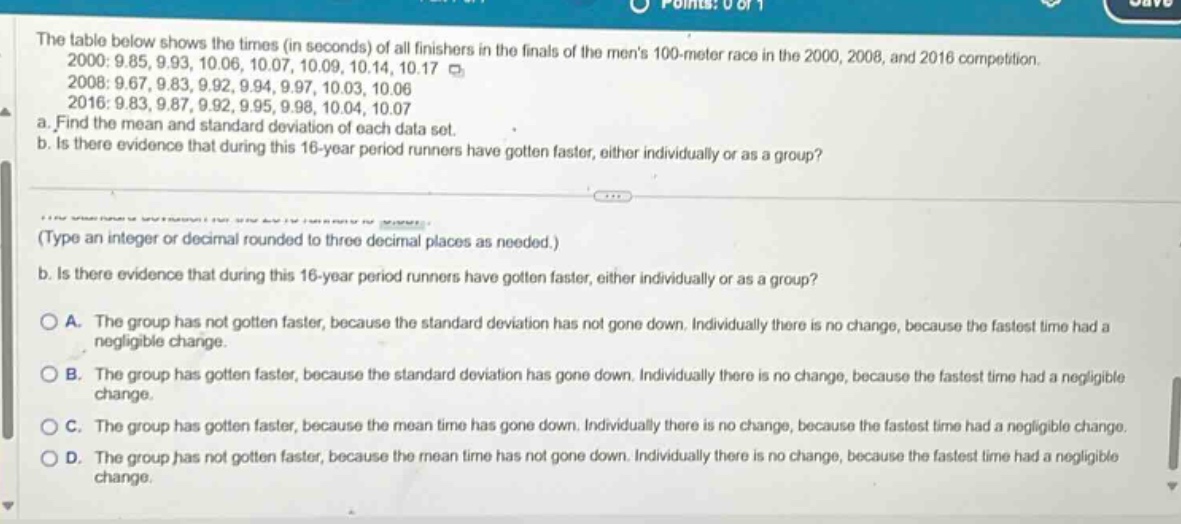
the table below shows the times (in seconds) of all finishers in the finals of the mens 100 - meter race in the 2000, 2008, and 2016 competition.\n2000: 9.85, 9.93, 10.06, 10.07, 10.09, 10.14, 10.17\n2008: 9.67, 9.83, 9.92, 9.94, 9.97, 10.03, 10.06\n2016: 9.83, 9.87, 9.92, 9.95, 9.98, 10.04, 10.07\na. find the mean and standard deviation of each data set.\nb. is there evidence that during this 16 - year period runners have gotten faster, either individually or as a group?\n(type an integer or decimal rounded to three decimal places as needed.)\nb. is there evidence that during this 16 - year period runners have gotten faster, either individually or as a group?\na. the group has not gotten faster, because the standard deviation has not gone down. individually there is no change, because the fastest time had a negligible change.\nb. the group has gotten faster, because the standard deviation has gone down. individually there is no change, because the fastest time had a negligible change.\nc. the group has gotten faster, because the mean time has gone down. individually there is no change, because the fastest time had a negligible change.\nd. the group has not gotten faster, because the mean time has not gone down. individually there is no change, because the fastest time had a negligible change.
Answer
Explanation:
Step1: Calculate mean for 2000 data - set
The formula for the mean $\bar{x}=\frac{\sum_{i = 1}^{n}x_{i}}{n}$. For the 2000 data - set $x = {9.85,9.93,10.06,10.07,10.09,10.14,10.17}$, $n = 7$. $\bar{x}_{2000}=\frac{9.85 + 9.93+10.06+10.07+10.09+10.14+10.17}{7}=\frac{70.31}{7}\approx10.044$
Step2: Calculate variance for 2000 data - set
The formula for the variance $s^{2}=\frac{\sum_{i = 1}^{n}(x_{i}-\bar{x})^{2}}{n - 1}$. $(9.85 - 10.044)^{2}=(-0.194)^{2}=0.037636$, $(9.93 - 10.044)^{2}=(-0.114)^{2}=0.012996$, $(10.06 - 10.044)^{2}=(0.016)^{2}=0.000256$, $(10.07 - 10.044)^{2}=(0.026)^{2}=0.000676$, $(10.09 - 10.044)^{2}=(0.046)^{2}=0.002116$, $(10.14 - 10.044)^{2}=(0.096)^{2}=0.009216$, $(10.17 - 10.044)^{2}=(0.126)^{2}=0.015876$. $\sum_{i = 1}^{7}(x_{i}-10.044)^{2}=0.037636 + 0.012996+0.000256+0.000676+0.002116+0.009216+0.015876 = 0.078772$. $s_{2000}^{2}=\frac{0.078772}{6}\approx0.01313$. $s_{2000}=\sqrt{0.01313}\approx0.1146$.
Step3: Calculate mean for 2008 data - set
For the 2008 data - set $x={9.67,9.83,9.92,9.94,9.97,10.03,10.06}$, $n = 7$. $\bar{x}_{2008}=\frac{9.67+9.83+9.92+9.94+9.97+10.03+10.06}{7}=\frac{69.42}{7}\approx9.917$
Step4: Calculate variance for 2008 data - set
$(9.67 - 9.917)^{2}=(-0.247)^{2}=0.061009$, $(9.83 - 9.917)^{2}=(-0.087)^{2}=0.007569$, $(9.92 - 9.917)^{2}=(0.003)^{2}=0.000009$, $(9.94 - 9.917)^{2}=(0.023)^{2}=0.000529$, $(9.97 - 9.917)^{2}=(0.053)^{2}=0.002809$, $(10.03 - 9.917)^{2}=(0.113)^{2}=0.012769$, $(10.06 - 9.917)^{2}=(0.143)^{2}=0.020449$. $\sum_{i = 1}^{7}(x_{i}-9.917)^{2}=0.061009+0.007569+0.000009+0.000529+0.002809+0.012769+0.020449 = 0.105143$. $s_{2008}^{2}=\frac{0.105143}{6}\approx0.01752$. $s_{2008}=\sqrt{0.01752}\approx0.1324$.
Step5: Calculate mean for 2016 data - set
For the 2016 data - set $x = {9.83,9.87,9.92,9.95,9.98,10.04,10.07}$, $n = 7$. $\bar{x}_{2016}=\frac{9.83+9.87+9.92+9.95+9.98+10.04+10.07}{7}=\frac{69.66}{7}\approx9.951$
Step6: Calculate variance for 2016 data - set
$(9.83 - 9.951)^{2}=(-0.121)^{2}=0.014641$, $(9.87 - 9.951)^{2}=(-0.081)^{2}=0.006561$, $(9.92 - 9.951)^{2}=(-0.031)^{2}=0.000961$, $(9.95 - 9.951)^{2}=(-0.001)^{2}=0.000001$, $(9.98 - 9.951)^{2}=(0.029)^{2}=0.000841$, $(10.04 - 9.951)^{2}=(0.089)^{2}=0.007921$, $(10.07 - 9.951)^{2}=(0.119)^{2}=0.014161$. $\sum_{i = 1}^{7}(x_{i}-9.951)^{2}=0.014641+0.006561+0.000961+0.000001+0.000841+0.007921+0.014161 = 0.045087$. $s_{2016}^{2}=\frac{0.045087}{6}\approx0.00751$. $s_{2016}=\sqrt{0.00751}\approx0.0867$.
Step7: Analyze the change
The mean time in 2000 is approximately $10.044$ s, in 2008 is approximately $9.917$ s, and in 2016 is approximately $9.951$ s. The mean time has decreased from 2000 to 2008 and then a small increase from 2008 to 2016, but overall the mean time has gone down from 2000 to 2016. The fastest time in 2000 is $9.85$ s, in 2008 is $9.67$ s and in 2016 is $9.83$ s. The change in the fastest - time is negligible.
Answer:
a. Mean of 2000: $10.044$, Standard deviation of 2000: $0.115$; Mean of 2008: $9.917$, Standard deviation of 2008: $0.132$; Mean of 2016: $9.951$, Standard deviation of 2016: $0.087$ b. C. The group has gotten faster, because the mean time has gone down. Individually there is no change, because the fastest time had a negligible change.