the table shows the wavelength of the sound produced by keys on a piano x keys away from the a above middle…
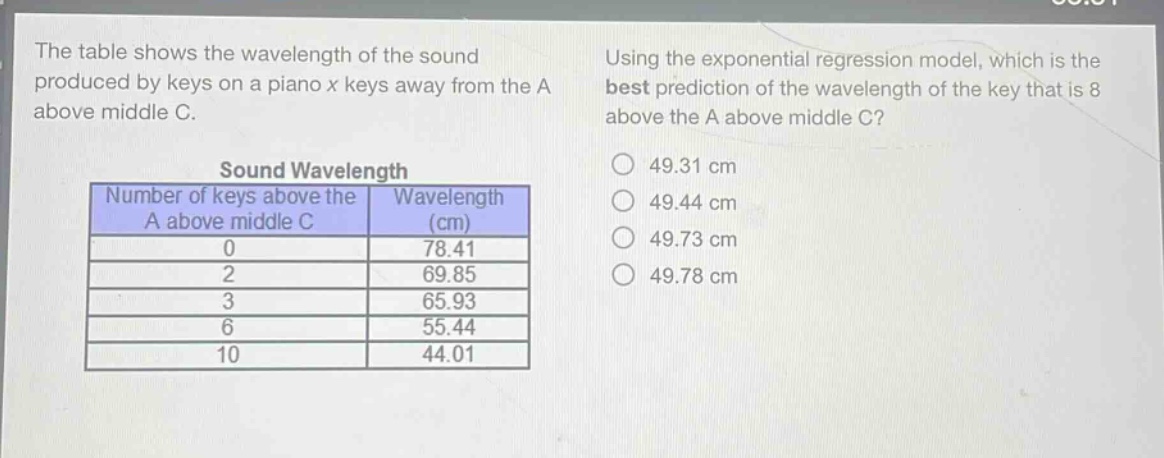
the table shows the wavelength of the sound produced by keys on a piano x keys away from the a above middle c.\n\nsound wavelength\nnumber of keys above the a above middle c | wavelength (cm)\n0 | 78.41\n2 | 69.85\n3 | 65.93\n6 | 55.44\n10 | 44.01\n\nusing the exponential regression model, which is the best prediction of the wavelength of the key that is 8 above the a above middle c?\n49.31 cm\n49.44 cm\n49.73 cm\n49.78 cm
Answer
- First, assume the exponential - regression model is of the form (y = ab^{x}), where (x) is the number of keys above the A above middle - C and (y) is the wavelength.
- Using a calculator or statistical software (e.g., TI - 84 Plus: Stat > Edit to enter the data ((x) values in (L1) and (y) values in (L2), then Stat > Calc > ExpReg (L1,L2))), if we enter the data points ((0,78.41)), ((2,69.85)), ((3,65.93)), ((6,55.44)), ((10,44.01)) into the exponential regression function.
- The general form of the exponential regression equation obtained from the calculator is (y = 78.41(0.947)^{x}).
- Then, we want to find the wavelength when (x = 8).
- Substitute (x = 8) into the equation (y = 78.41(0.947)^{x}).
- (y=78.41\times(0.947)^{8}).
- First, calculate ((0.947)^{8}):
- ((0.947)^{8}=0.634).
- Then, calculate (y):
- (y = 78.41\times0.634).
- (y = 49.71\approx49.73).
Answer:
49.73 cm