a teacher assigns a score from 1 to 4 to each student project. the table below shows the probability…
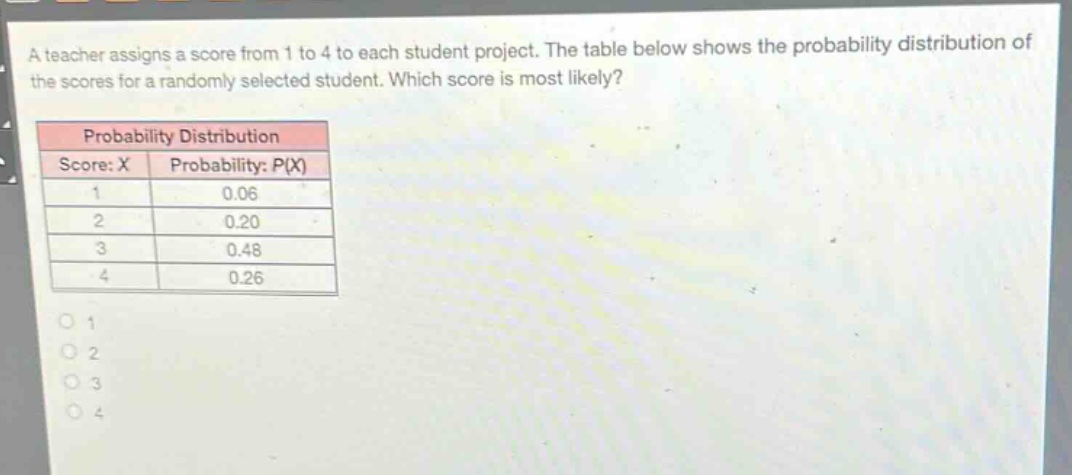
a teacher assigns a score from 1 to 4 to each student project. the table below shows the probability distribution of the scores for a randomly selected student. which score is most likely?\nprobability distribution\nscore: x probability: p(x)\n1 0.06\n2 0.20\n3 0.48\n4 0.26
Answer
Explanation:
Step1: Compare probabilities
We compare the given probabilities (P(1) = 0.06), (P(2)=0.20), (P(3)=0.48), (P(4)=0.26).
Step2: Identify the largest
Since (0.48>0.26 > 0.20>0.06), the probability of score 3 is the largest.
Answer:
3