temperature of water bottle\na bottle of water is placed in a freezer. the table shows how the approximate…
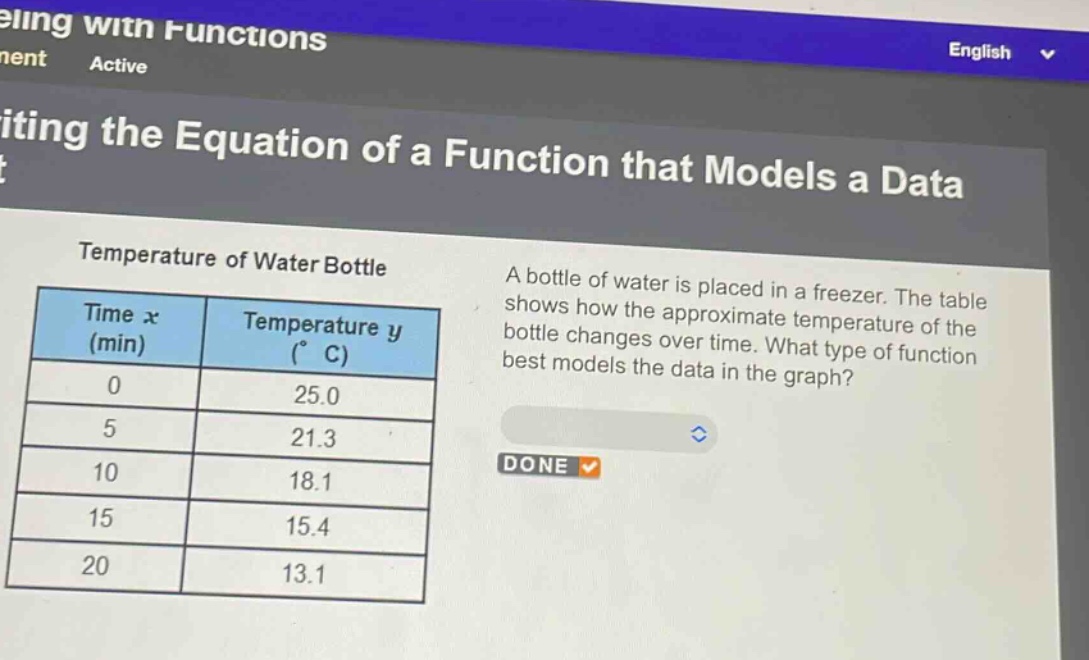
temperature of water bottle\na bottle of water is placed in a freezer. the table shows how the approximate temperature of the bottle changes over time. what type of function best models the data in the graph?\n| time x (min) | temperature y (°c) |\n| ---- | ---- |\n| 0 | 25.0 |\n| 5 | 21.3 |\n| 10 | 18.1 |\n| 15 | 15.4 |\n| 20 | 13.1 |
Answer
Answer:
Exponential decay function
Explanation:
Step1: Analyze data trend
As time $x$ increases, temperature $y$ decreases.
Step2: Check rate of change
The difference in temperature between consecutive time - intervals is not constant. For example, from $x = 0$ to $x = 5$, $y$ changes by $25.0 - 21.3=3.7$. From $x = 5$ to $x = 10$, $y$ changes by $21.3 - 18.1 = 3.2$. The rate of change of the temperature is not linear.
Step3: Identify function type
In an exponential decay function, the quantity decreases at a rate proportional to its current value. The temperature of the water - bottle decreases in a way that is characteristic of exponential decay as it approaches the temperature of the freezer over time.