2 a test administered to a statistic class of 50 students resulted in the ff scores\n45 65 33 72 50 36 43…
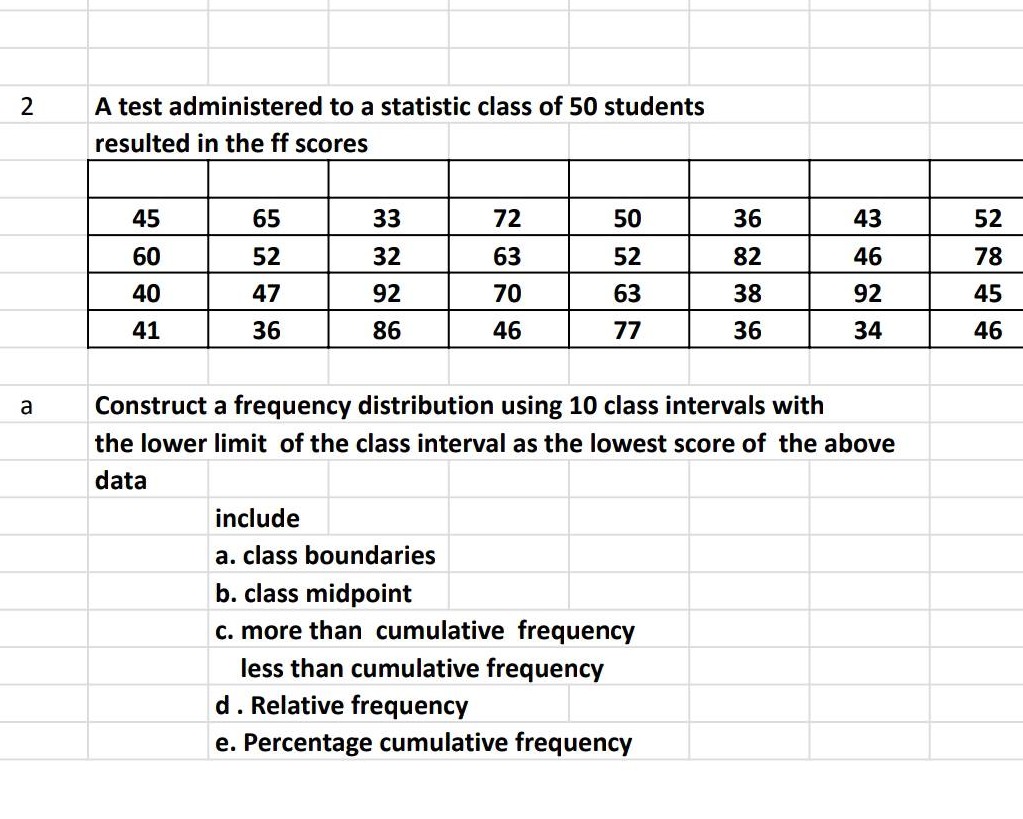
2 a test administered to a statistic class of 50 students resulted in the ff scores\n45 65 33 72 50 36 43 52\n60 52 32 63 52 82 46 78\n40 47 92 70 63 38 92 45\n41 36 86 46 77 36 34 46\na construct a frequency distribution using 10 class intervals with the lower limit of the class interval as the lowest score of the above data\ninclude\na. class boundaries\nb. class midpoint\nc. more than cumulative frequency less than cumulative frequency\nd. relative frequency\ne. percentage cumulative frequency
Answer
Explanation:
Step1: Find the range
The lowest score is 32 and the highest score is 92. Range = $92 - 32=60$.
Step2: Determine the class - width
Since we want 10 class intervals, class - width = $\frac{60}{10}=6$.
Step3: Define the class intervals
The first lower - limit is 32. The class intervals are: 32 - 37, 38 - 43, 44 - 49, 50 - 55, 56 - 61, 62 - 67, 68 - 73, 74 - 79, 80 - 85, 86 - 91, 92 - 97.
Step4: Calculate the frequencies
Count the number of scores in each class interval.
Step5: Calculate class boundaries
For the class interval 32 - 37, the lower class boundary is 31.5 and the upper class boundary is 37.5. Do this for all class intervals.
Step6: Calculate class mid - points
For the class interval 32 - 37, mid - point=$\frac{32 + 37}{2}=34.5$. Do this for all class intervals.
Step7: Calculate less than cumulative frequency
Start with the frequency of the first class and keep adding the frequencies of the subsequent classes.
Step8: Calculate more than cumulative frequency
Start with the total number of data points (50) and subtract the frequencies of the classes one by one.
Step9: Calculate relative frequency
Relative frequency of a class = $\frac{\text{Frequency of the class}}{\text{Total number of data points}}$.
Step10: Calculate percentage cumulative frequency
Percentage cumulative frequency of a class = $\frac{\text{Cumulative frequency of the class}}{\text{Total number of data points}}\times100$.
| Class Interval | Class Boundaries | Class Mid - point | Frequency | Less than Cumulative Frequency | More than Cumulative Frequency | Relative Frequency | Percentage Cumulative Frequency |
|---|---|---|---|---|---|---|---|
| 32 - 37 | 31.5 - 37.5 | 34.5 | 7 | 7 | 50 | $\frac{7}{50}=0.14$ | $\frac{7}{50}\times100 = 14%$ |
| 38 - 43 | 37.5 - 43.5 | 40.5 | 6 | 13 | 43 | $\frac{6}{50}=0.12$ | $\frac{13}{50}\times100 = 26%$ |
| 44 - 49 | 43.5 - 49.5 | 46.5 | 10 | 23 | 37 | $\frac{10}{50}=0.2$ | $\frac{23}{50}\times100 = 46%$ |
| 50 - 55 | 49.5 - 55.5 | 52.5 | 5 | 28 | 27 | $\frac{5}{50}=0.1$ | $\frac{28}{50}\times100 = 56%$ |
| 56 - 61 | 55.5 - 61.5 | 58.5 | 2 | 30 | 22 | $\frac{2}{50}=0.04$ | $\frac{30}{50}\times100 = 60%$ |
| 62 - 67 | 61.5 - 67.5 | 64.5 | 4 | 34 | 20 | $\frac{4}{50}=0.08$ | $\frac{34}{50}\times100 = 68%$ |
| 68 - 73 | 67.5 - 73.5 | 70.5 | 3 | 37 | 16 | $\frac{3}{50}=0.06$ | $\frac{37}{50}\times100 = 74%$ |
| 74 - 79 | 73.5 - 79.5 | 76.5 | 3 | 40 | 13 | $\frac{3}{50}=0.06$ | $\frac{40}{50}\times100 = 80%$ |
| 80 - 85 | 80.5 - 85.5 | 82.5 | 2 | 42 | 10 | $\frac{2}{50}=0.04$ | $\frac{42}{50}\times100 = 84%$ |
| 86 - 91 | 85.5 - 91.5 | 88.5 | 3 | 45 | 8 | $\frac{3}{50}=0.06$ | $\frac{45}{50}\times100 = 90%$ |
| 92 - 97 | 91.5 - 97.5 | 94.5 | 5 | 50 | 5 | $\frac{5}{50}=0.1$ | $\frac{50}{50}\times100 = 100%$ |
Answer:
The frequency distribution table is shown above.