test scores\nms. dobsons class\ndistrict - wide\n0 10 20 30 40 50 60 70 80 90 100 110\nwhich statement is…
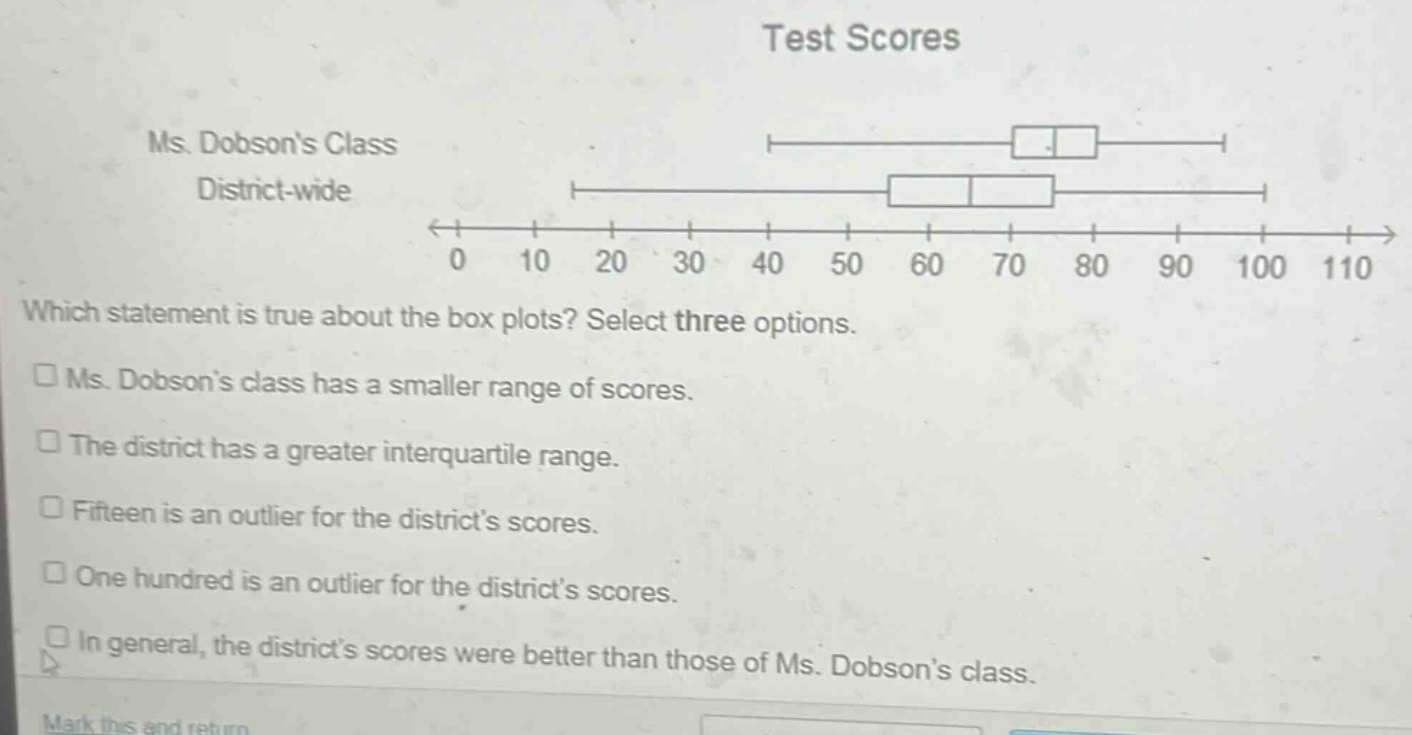
test scores\nms. dobsons class\ndistrict - wide\n0 10 20 30 40 50 60 70 80 90 100 110\nwhich statement is true about the box plots? select three options.\n□ ms. dobsons class has a smaller range of scores.\n□ the district has a greater interquartile range.\n□ fifteen is an outlier for the districts scores.\n□ one hundred is an outlier for the districts scores.\n□ in general, the districts scores were better than those of ms. dobsons class.
Answer
Answer:
- The district has a greater interquartile range.
- Fifteen is an outlier for the district's scores.
- In general, the district's scores were better than those of Ms. Dobson's class.
Explanation:
Step1: Analyze range
Range = max - min. Ms. Dobson's class range is larger as its whiskers are more spread.
Step2: Analyze inter - quartile range
IQR = Q3 - Q1. District's box (IQR) is wider than Ms. Dobson's.
Step3: Analyze outliers
For district, lower fence = Q1 - 1.5*IQR. 15 is below lower fence, so it's an outlier. 100 is not an outlier.
Step4: Analyze overall scores
District's median and overall box - plot position is higher, so its scores are better.