test yourself! practice tool\nthe table below shows the preferences of 86 members of the national honor…
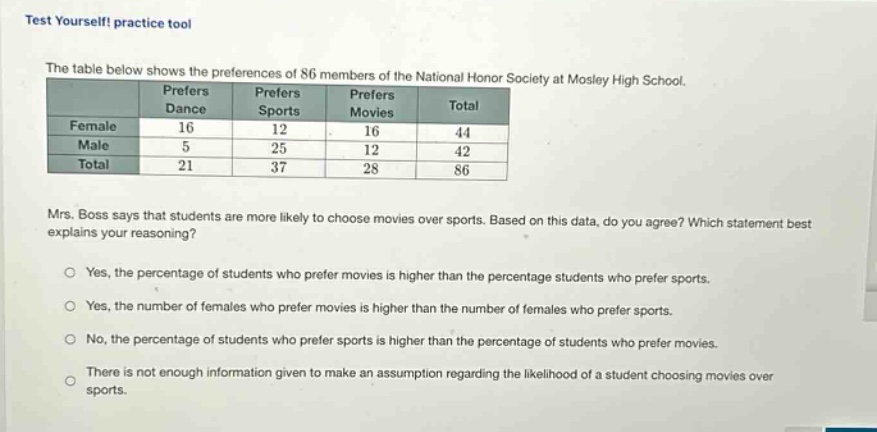
test yourself! practice tool\nthe table below shows the preferences of 86 members of the national honor society at mosley high school.\n| | prefers dance | prefers sports | prefers movies | total |\n|--|--|--|--|--|\n| female | 16 | 12 | 16 | 44 |\n| male | 5 | 25 | 12 | 42 |\n| total | 21 | 37 | 28 | 86 |\nmrs. boss says that students are more likely to choose movies over sports. based on this data, do you agree? which statement best explains your reasoning?\nyes, the percentage of students who prefer movies is higher than the percentage students who prefer sports.\nyes, the number of females who prefer movies is higher than the number of females who prefer sports.\nno, the percentage of students who prefer sports is higher than the percentage of students who prefer movies.\nthere is not enough information given to make an assumption regarding the likelihood of a student choosing movies over sports.
Answer
Explanation:
Step1: Calculate percentage of students who prefer sports
The number of students who prefer sports is 37 out of 86. The percentage is $\frac{37}{86}\times100%\approx43.02%$.
Step2: Calculate percentage of students who prefer movies
The number of students who prefer movies is 28 out of 86. The percentage is $\frac{28}{86}\times100%\approx32.56%$.
Step3: Compare the percentages
Since $43.02%>32.56%$, the percentage of students who prefer sports is higher than the percentage of students who prefer movies.
Answer:
No, the percentage of students who prefer sports is higher than the percentage of students who prefer movies.