thirty - four high school students were surveyed and asked how many siblings they have. the dotplot below…
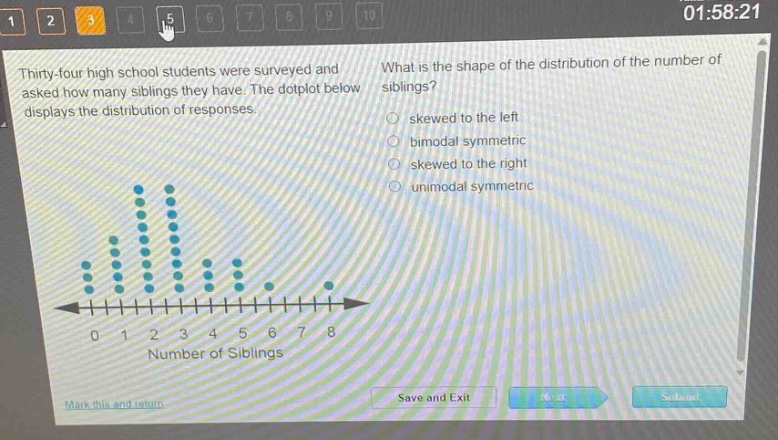
thirty - four high school students were surveyed and asked how many siblings they have. the dotplot below displays the distribution of responses. what is the shape of the distribution of the number of siblings? skewed to the left bimodal symmetric skewed to the right unimodal symmetric 0 1 2 3 4 5 6 7 8 number of siblings
Answer
Explanation:
Step1: Analyze the dot - plot
The majority of the data is on the left side of the plot, and the tail extends to the right.
Step2: Recall distribution shapes
A distribution is skewed to the right when the tail is on the right - hand side.
Answer:
skewed to the right