the three scatter plots below show the same data set. choose the scatter plot in which the outlier is…
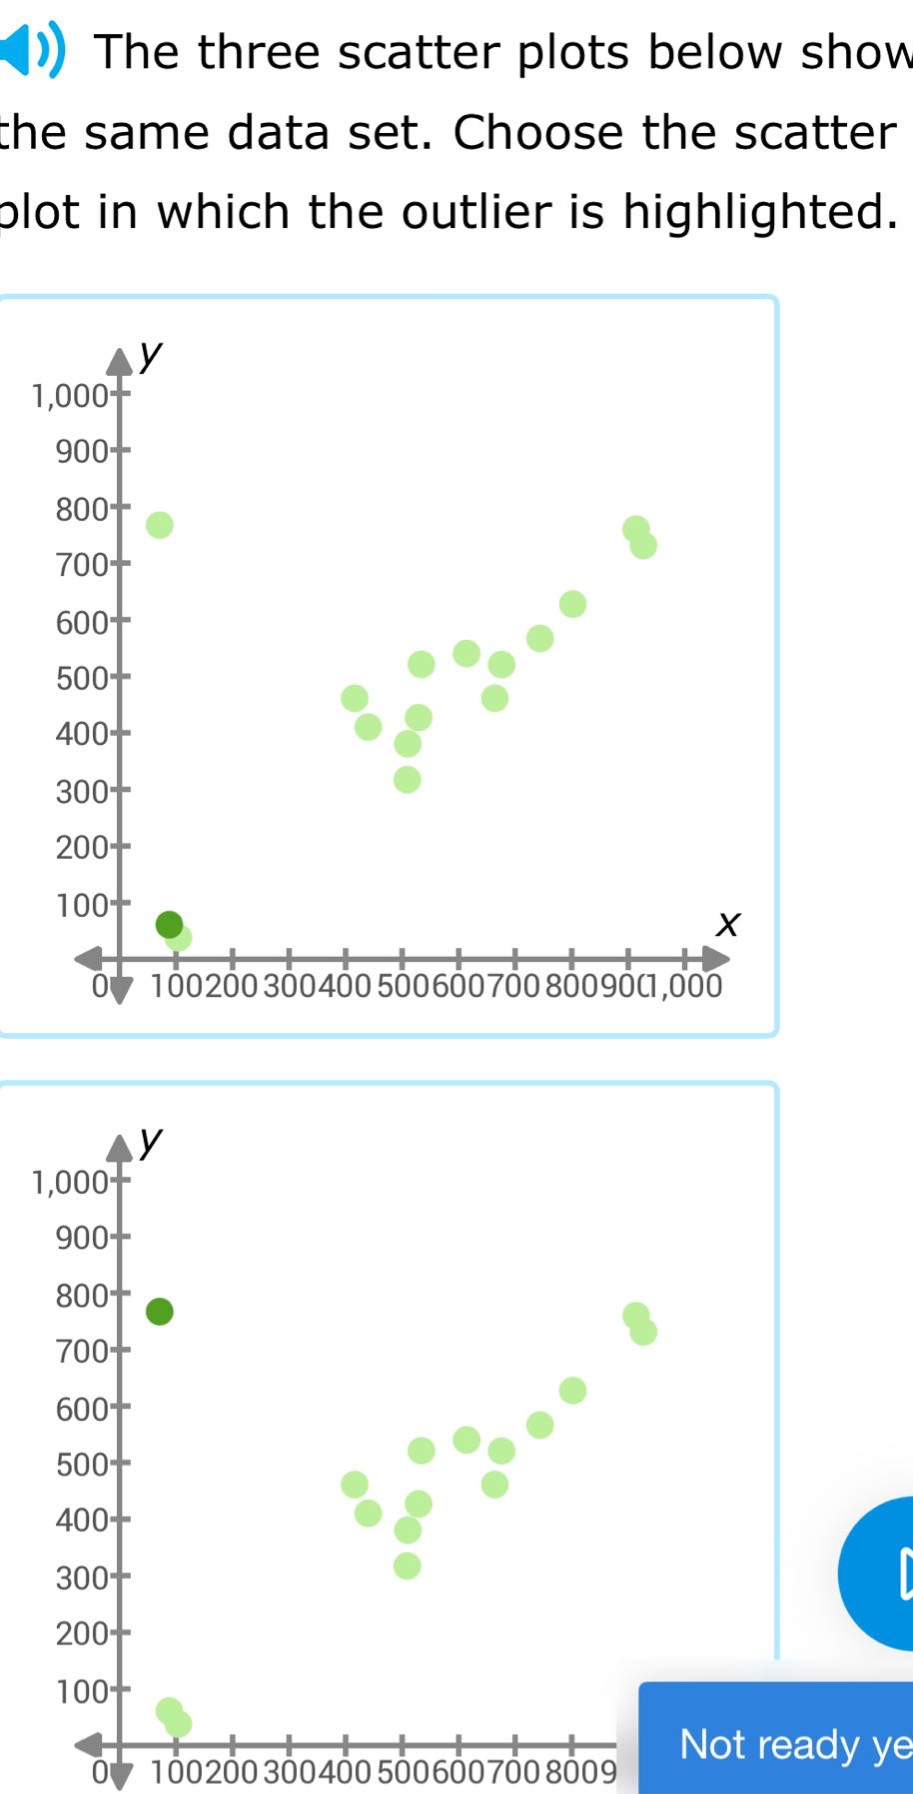
the three scatter plots below show the same data set. choose the scatter plot in which the outlier is highlighted.
Answer
Answer:
The second scatter - plot.
Explanation:
Step1: Identify outlier concept
An outlier is a data point that is far from other data points.
Step2: Examine first plot
In the first plot, the highlighted point near (x = 100,y=100) is not far from other points in the cluster near the origin.
Step3: Examine second plot
In the second plot, the highlighted point at (y\approx800) is far from the main cluster of points which are mostly in the (y - )range of (300 - 700). So it is an outlier.