the three scatter plots below show the same data - set. choose the scatter plot in which the outlier is…
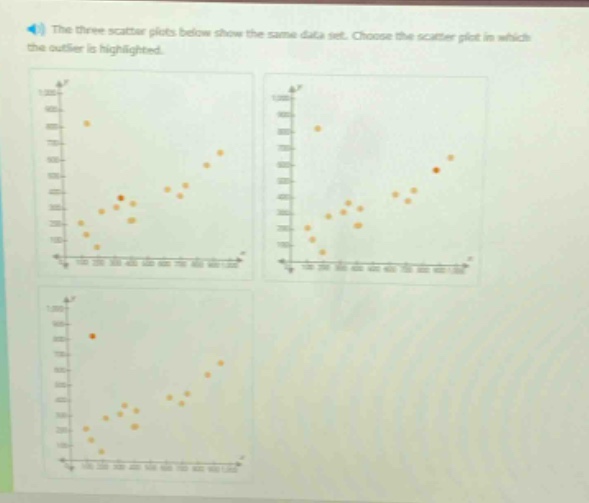
the three scatter plots below show the same data - set. choose the scatter plot in which the outlier is highlighted.
Answer
Explanation:
Step1: Recall outlier definition
An outlier is a data - point that is far from other data - points.
Step2: Examine scatter - plots
In the bottom - left scatter - plot, there is a single data - point that is much higher on the y - axis compared to the rest of the data points in the set. This data - point is far from the general cluster of points.
Answer:
The bottom - left scatter - plot.