tony rides his bike to school. this morning, he was running late, so he biked very quickly. he stayed at…
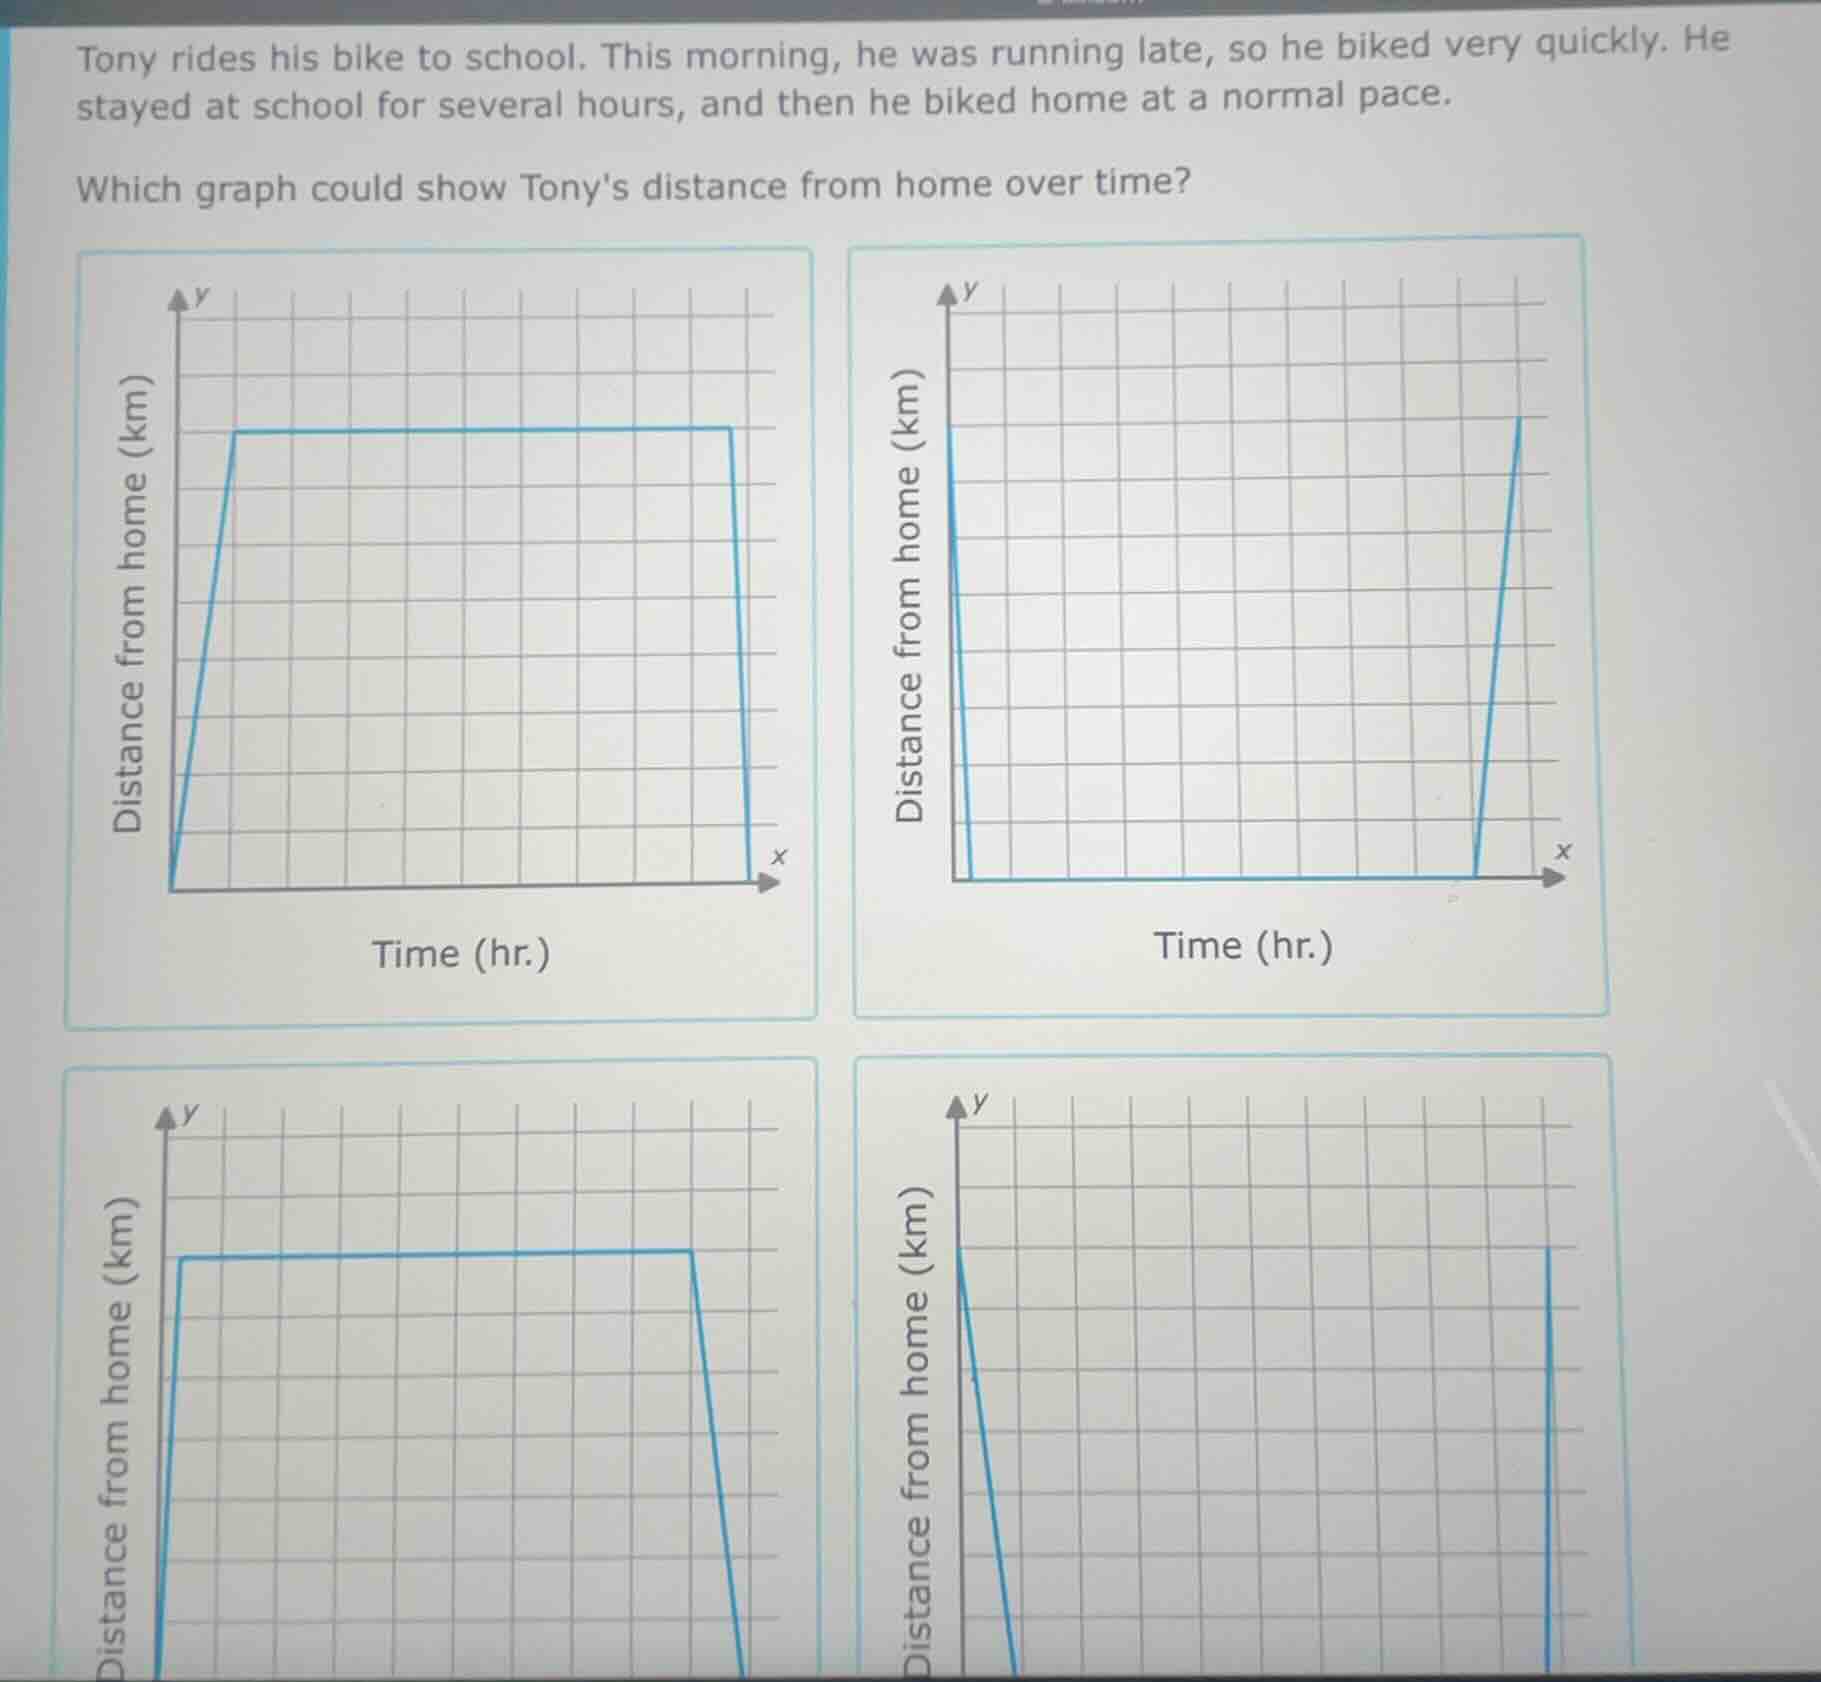
tony rides his bike to school. this morning, he was running late, so he biked very quickly. he stayed at school for several hours, and then he biked home at a normal pace.\nwhich graph could show tonys distance from home over time?
Answer
Explanation:
Step1: Analyze first segment (to school)
Tony starts at home (distance = 0 km) and bikes quickly to school. On a distance-time graph, this is a steep upward-sloping line (high speed = steep slope) going from (0, 0) to a positive distance value.
Step2: Analyze second segment (at school)
Tony stays at school for hours, so his distance from home does not change. This is a horizontal line (slope = 0) at the constant distance of the school from home.
Step3: Analyze third segment (return home)
Tony bikes home at a normal pace, which is slower than his morning speed. On the graph, this is a downward-sloping line with a less steep slope than the first segment, going from the school's distance back to 0 km.
Step4: Match to graphs
Only the bottom-left graph has: a steep upward slope from 0, a flat horizontal segment, and a less steep downward slope back to 0. The top-left graph has an overly steep downward slope (faster than the trip to school, which contradicts the "normal pace" return), the top-right graph starts at a non-zero distance and ends at a high distance (wrong direction), and the bottom-right graph starts at a non-zero distance and has no flat segment (no time at school).
Answer:
The bottom-left graph (with a steep upward line, flat horizontal line, and moderately steep downward line)