a b c total d 0.12 0.78 0.10 1.0 e r s t 1.0 total u x y 1.0 which value for r in the table would most…
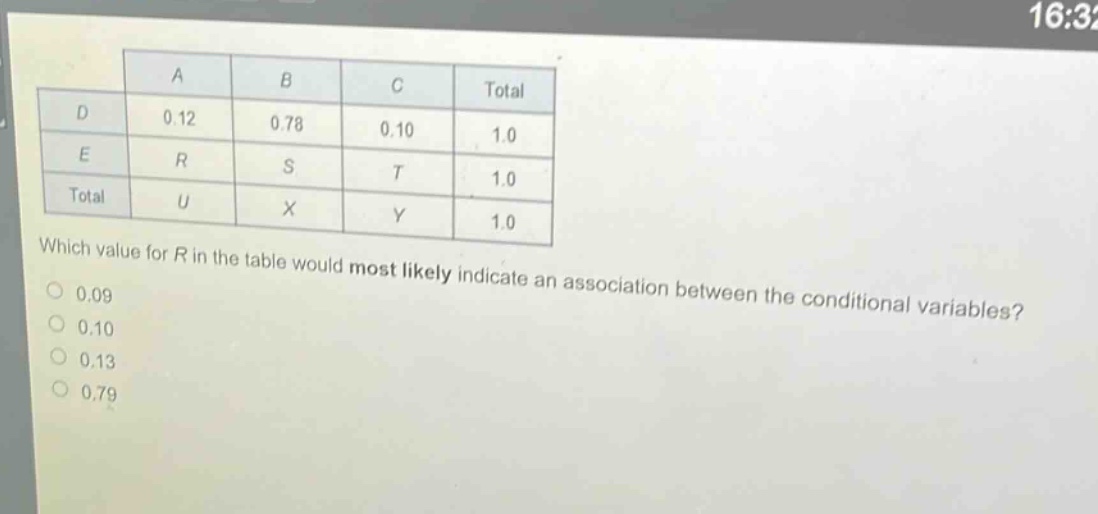
a b c total d 0.12 0.78 0.10 1.0 e r s t 1.0 total u x y 1.0 which value for r in the table would most likely indicate an association between the conditional variables? 0.09 0.10 0.13 0.79
Answer
Explanation:
Step1: Recall independence condition
If the variables are independent, the joint - probabilities follow the rule (P(A\cap D)=P(A)\times P(D)). In a two - way table, if the rows and columns are independent, the proportion of values in each cell should follow a certain pattern. For independence, we would expect the values in the cells to be such that the distribution across rows and columns is uniform. If there is an association, the values will deviate from the expected values under independence. The total for row (D) is (1.0), and the total for the whole table is also (1.0). If the variables were independent, we would expect the proportion of values in each cell of row (E) to be similar to the proportion of values in the corresponding columns in row (D). Since the value in the first cell of row (D) is (0.12), if the variables were independent, we would expect (R) to be close to (0.12). A value that is far from (0.12) would indicate an association.
Step2: Analyze the options
We are given options: (0.09), (0.10), (0.13), (0.79). The value (0.79) is very different from (0.12). If (R = 0.79), it means that the distribution of the variable in row (E) for category (A) is very different from the distribution in row (D) for category (A), which is a strong indication of an association between the conditional variables.
Answer:
0.79