the total number of dental clinics hosted for the last 12 months was recorded. which type of graph would…
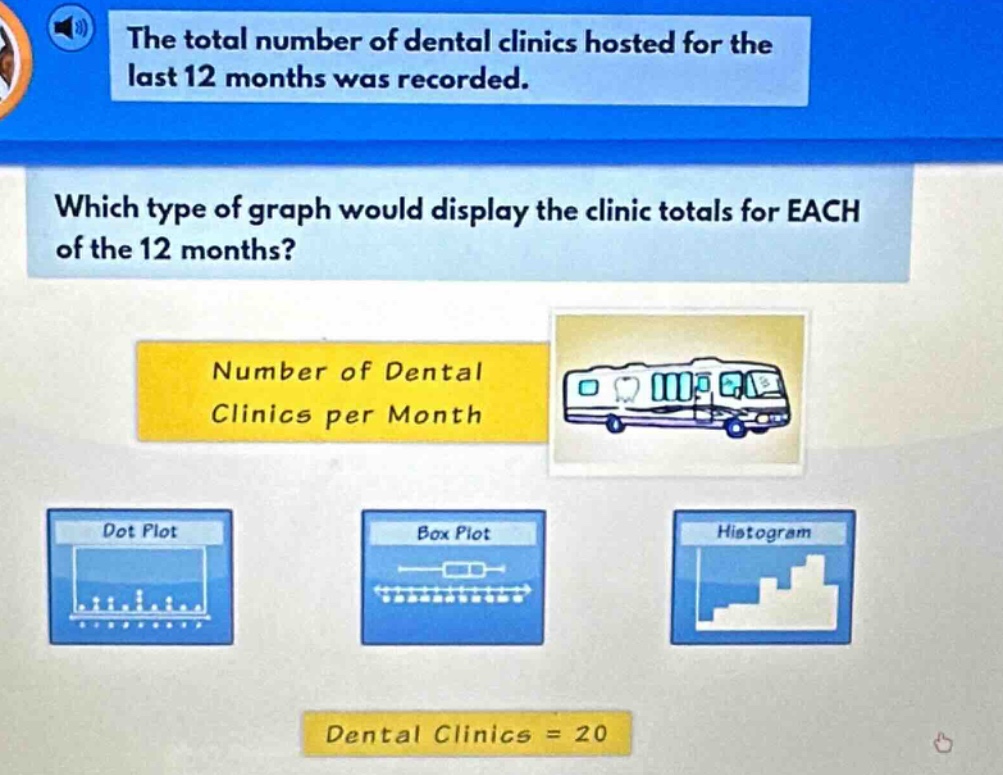
the total number of dental clinics hosted for the last 12 months was recorded. which type of graph would display the clinic totals for each of the 12 months? number of dental clinics per month dental clinics = 20
Answer
Brief Explanations:
A dot - plot shows the frequency of data points along a number line. It is suitable for showing individual data values over time (in this case, the number of dental clinics per month). A box - plot shows the distribution characteristics like median, quartiles etc. and is not ideal for showing individual monthly totals. A histogram is used for grouped data and not for individual monthly counts.
Answer:
Dot Plot