when the track season started, coach calhoun recorded how long it took each athlete to run a mile. when the…
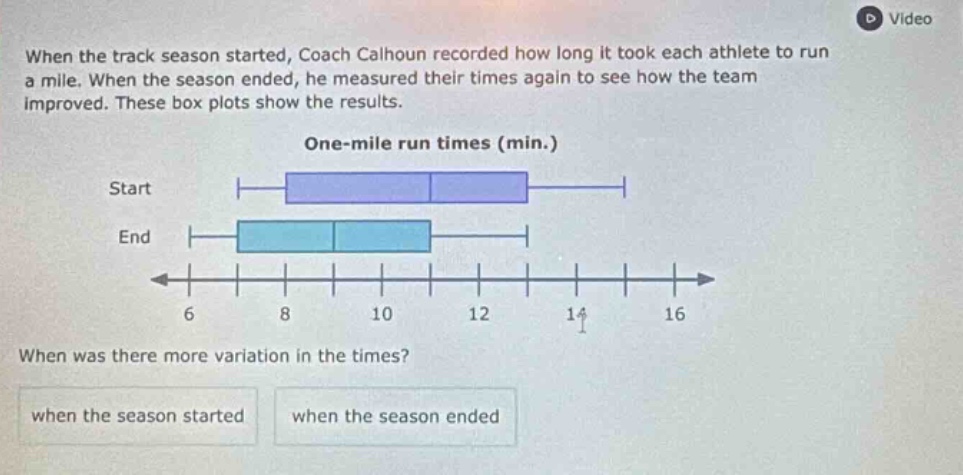
when the track season started, coach calhoun recorded how long it took each athlete to run a mile. when the season ended, he measured their times again to see how the team improved. these box plots show the results. one - mile run times (min.) start end when was there more variation in the times? when the season started when the season ended
Answer
Answer:
when the season started
Explanation:
Step1: Observar rango inter - cuartil
El rango inter - cuartil (IQR) es una medida de variación. En un diagrama de caja, el IQR es la longitud de la caja.
Step2: Comparar IQRs
La caja para el comienzo de la temporada es más larga que la caja para el final de la temporada. Esto significa que el IQR es mayor al comienzo de la temporada, lo que implica más variación en los tiempos.