which tree diagram represents the sample space of this compound event?
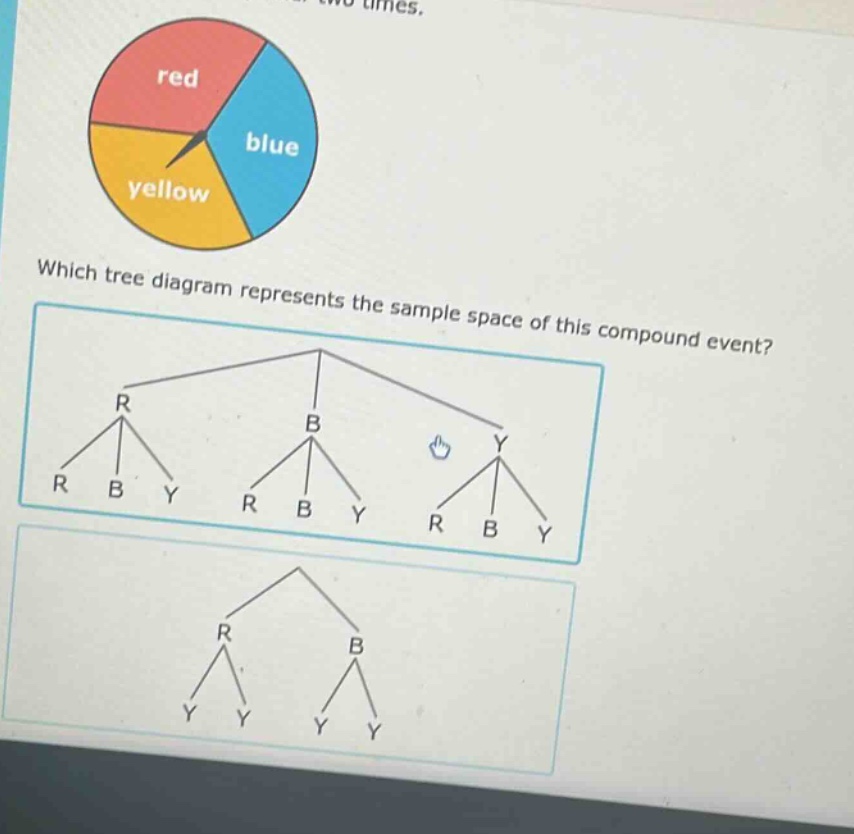
which tree diagram represents the sample space of this compound event?
Answer
Answer:
The first tree - diagram (the one with three main branches labeled R, B, Y and each of those branches having three sub - branches labeled R, B, Y) represents the sample space of the compound event.
Explanation:
Step1: Identify the events
The spinner has 3 colors: red (R), blue (B), yellow (Y).
Step2: Understand the compound event
The spinner is spun two times.
Step3: Analyze the sample - space requirements
For a two - spin event, starting with each of the 3 first - spin outcomes (R, B, Y), there should be 3 possible second - spin outcomes. The first tree - diagram shows this correctly as each of the R, B, Y main branches has 3 sub - branches (R, B, Y), while the second tree - diagram does not account for all possible combinations.