which trend line has been drawn correctly using the divide - center method?
which trend line has been drawn correctly using the divide - center method?
Answer
Explanation:
Step1: Recall divide - center method
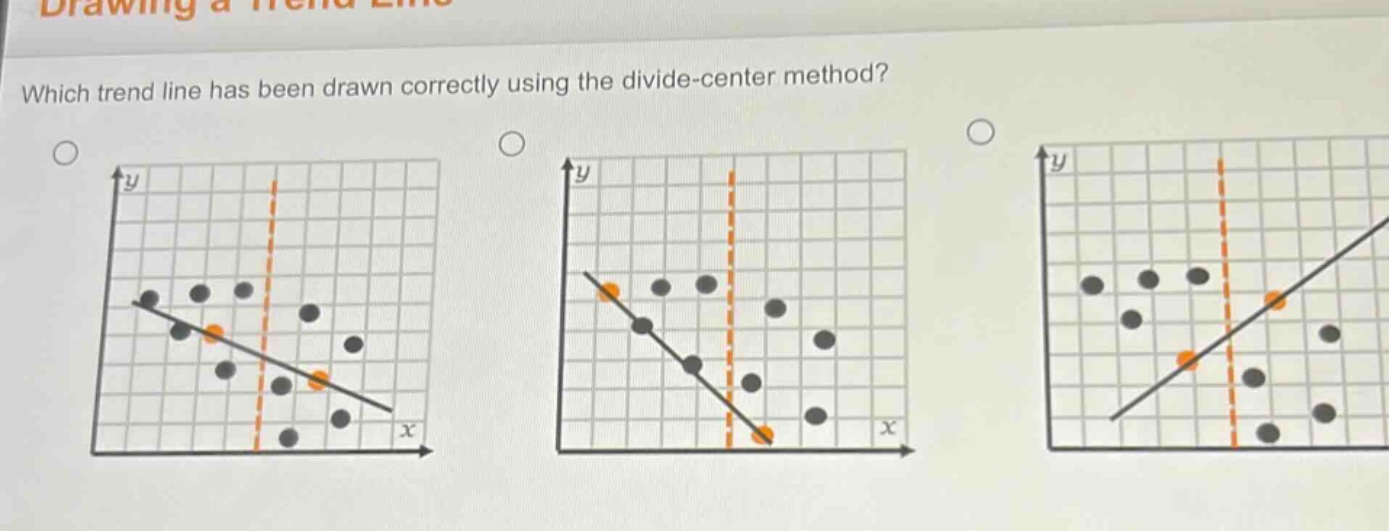
In the divide - center method, we first divide the data points into two equal - sized groups (left and right of a vertical line). Then we find the center of each group (average of x and y values of points in each group). The trend line should pass as close as possible to these centers.
Step2: Analyze first graph
The vertical line divides the points into two groups. The centers of the two groups are marked by orange dots. The line passes through or close to these centers, which is consistent with the divide - center method.
Step3: Analyze second graph
The line does not seem to pass through or close to the centers of the two groups divided by the vertical line.
Step4: Analyze third graph
The line does not pass through or close to the centers of the two groups divided by the vertical line.