which trend line properly describes the data relationship in the scatterplot?
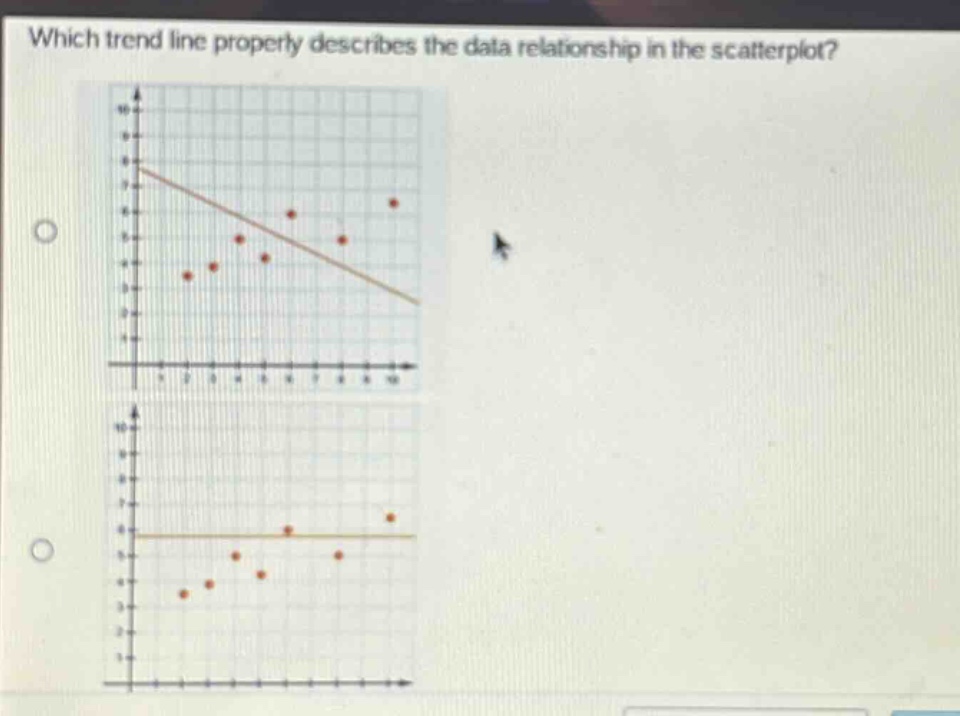
which trend line properly describes the data relationship in the scatterplot?
Answer
Explanation:
Step1: Observe data trend
The data points in the scatter - plot are generally increasing from left to right. A positive - sloped line would best fit the data. The first line shown has a negative slope and the second line is horizontal. Neither of these match the upward - trending data.
Answer:
Neither of the given lines properly describes the data relationship as the data has an upward trend and neither of the lines shown have a positive slope.