try to draw a line to approximate the points in the graph. is the correlation between the variables positive…
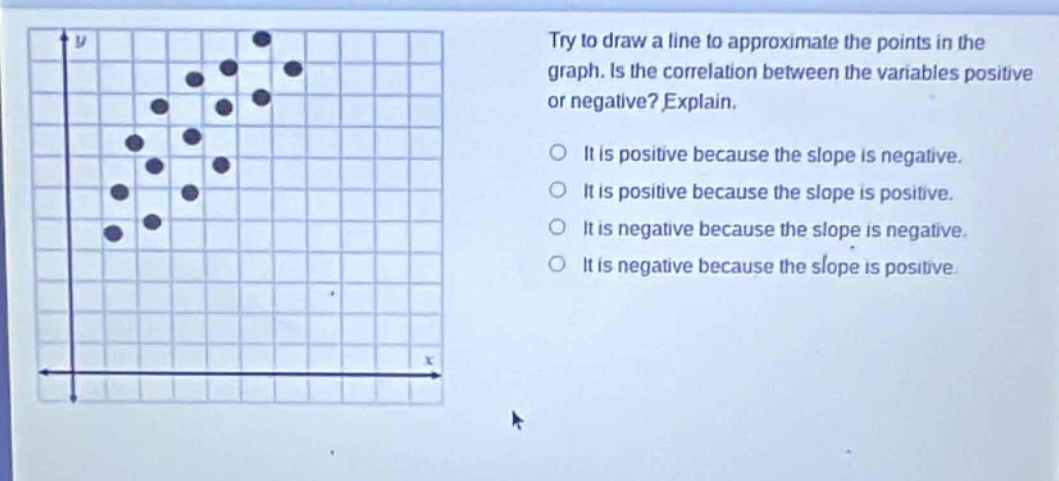
try to draw a line to approximate the points in the graph. is the correlation between the variables positive or negative? explain.\nit is positive because the slope is negative.\nit is positive because the slope is positive.\nit is negative because the slope is negative.\nit is negative because the slope is positive.
Answer
Explanation:
Step1: Understand correlation and slope
Positive correlation means as one variable increases, the other increases. It has a positive - sloped line of best - fit. Negative correlation means as one variable increases, the other decreases, with a negative - sloped line of best - fit.
Step2: Analyze the scatter - plot
Looking at the scatter - plot, as the value of (x) increases, the value of (y) also increases. So, the line of best - fit will have a positive slope.
Answer:
It is positive because the slope is positive.