which two data sets appear to be normally distributed?\na.\n| value | 5 | 10 | 15 | 20 | 25 | 30 | 35 | 40 |…
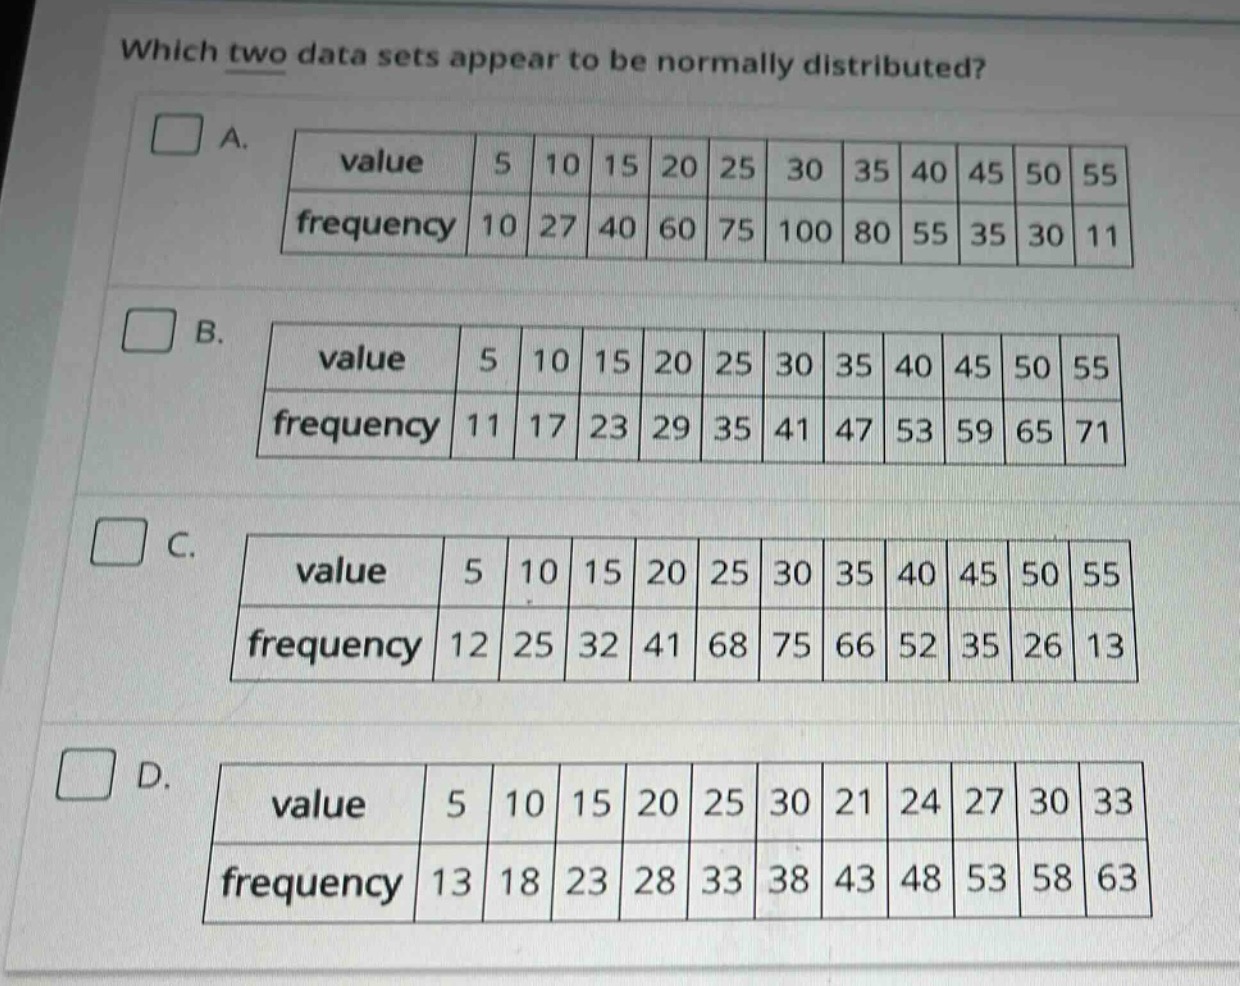
which two data sets appear to be normally distributed?\na.\n| value | 5 | 10 | 15 | 20 | 25 | 30 | 35 | 40 | 45 | 50 | 55 |\n| frequency | 10 | 27 | 40 | 60 | 75 | 100 | 80 | 55 | 35 | 30 | 11 |\nb.\n| value | 5 | 10 | 15 | 20 | 25 | 30 | 35 | 40 | 45 | 50 | 55 |\n| frequency | 11 | 17 | 23 | 29 | 35 | 41 | 47 | 53 | 59 | 65 | 71 |\nc.\n| value | 5 | 10 | 15 | 20 | 25 | 30 | 35 | 40 | 45 | 50 | 55 |\n| frequency | 12 | 25 | 32 | 41 | 68 | 75 | 66 | 52 | 35 | 26 | 13 |\nd.\n| value | 5 | 10 | 15 | 20 | 25 | 30 | 21 | 24 | 27 | 30 | 33 |\n| frequency | 13 | 18 | 23 | 28 | 33 | 38 | 43 | 48 | 53 | 58 | 63 |
Answer
Explanation:
Step1: Recall normal - distribution property
A normal distribution has a bell - shaped curve, with the highest frequency in the middle and symmetrically decreasing frequencies on either side.
Step2: Analyze dataset A
The frequencies in dataset A increase from 10 to 100 (at the middle value of 30) and then decrease symmetrically to 11, showing a bell - shaped pattern.
Step3: Analyze dataset B
The frequencies in dataset B increase steadily from 11 to 71 without a peak in the middle and then decrease, so it is not bell - shaped.
Step4: Analyze dataset C
The frequencies in dataset C increase from 12 to 75 (at the middle value of 30) and then decrease symmetrically to 13, showing a bell - shaped pattern.
Step5: Analyze dataset D
The values and frequencies in dataset D do not follow a bell - shaped pattern as the values are not in a regular sequence for comparison with normal distribution characteristics.
Answer:
A. value: 5, 10, 15, 20, 25, 30, 35, 40, 45, 50, 55; frequency: 10, 27, 40, 60, 75, 100, 80, 55, 35, 30, 11 C. value: 5, 10, 15, 20, 25, 30, 35, 40, 45, 50, 55; frequency: 12, 25, 32, 41, 68, 75, 66, 52, 35, 26, 13