two data sets are summarized in the box plots shown. which statements comparing the two box plots are…
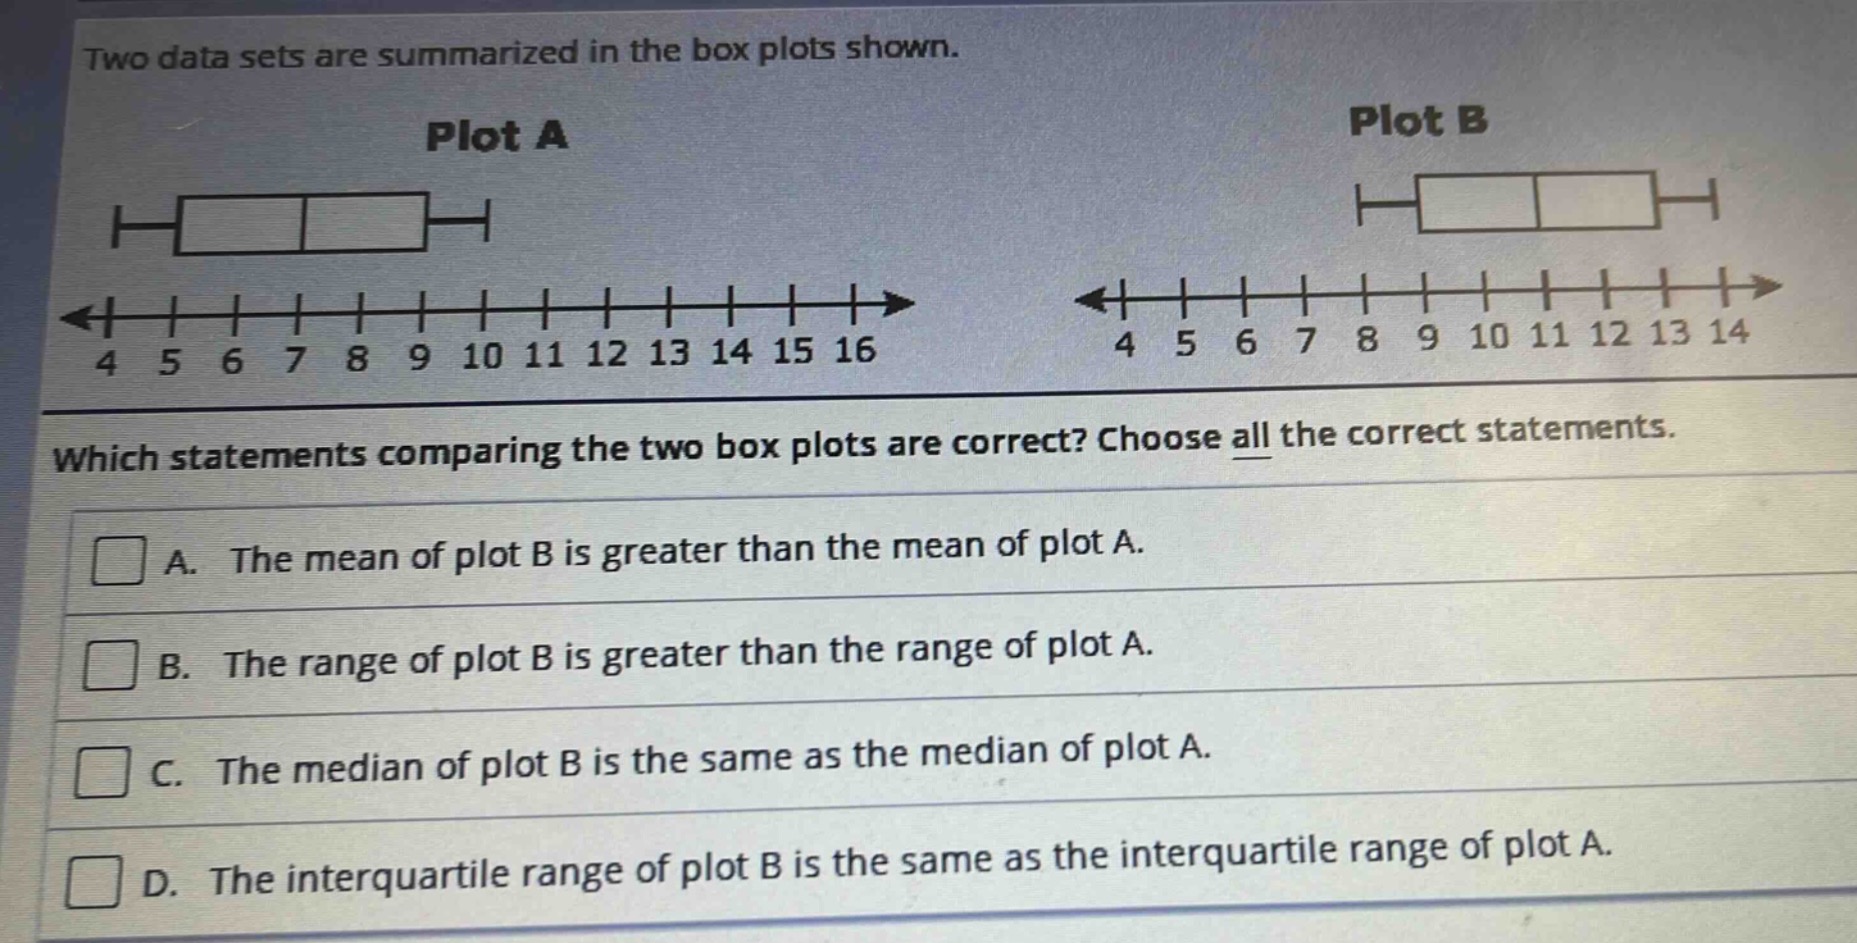
two data sets are summarized in the box plots shown. which statements comparing the two box plots are correct? choose all the correct statements. a. the mean of plot b is greater than the mean of plot a. b. the range of plot b is greater than the range of plot a. c. the median of plot b is the same as the median of plot a. d. the interquartile range of plot b is the same as the interquartile range of plot a.
Answer
Answer:
C. The median of plot B is the same as the median of plot A. D. The interquartile range of plot B is the same as the interquartile range of plot A.
Explanation:
Step1: Identificar medianas
En un diagrama de caja, la línea interior representa la mediana. En Plot A y Plot B, la mediana está en 9.
Step2: Identificar rango intercuartílico
El rango intercuartílico (RIC) es la diferencia entre el tercer cuartil (Q3) y el primer cuartil (Q1). En ambos diagramas, Q1 = 7 y Q3 = 11, entonces RIC = 11 - 7 = 4 para ambos.
Step3: Analizar la media
No se puede determinar la media solo con el diagrama de caja, entonces no se puede asegurar que la media de Plot B sea mayor que la de Plot A.
Step4: Analizar el rango
El rango es la diferencia entre el valor máximo y el valor mínimo. En Plot A, rango = 16 - 4 = 12. En Plot B, rango = 14 - 4 = 10. Entonces el rango de Plot B no es mayor que el de Plot A.