which two points should the trend line go through to best represent the data given in this scatterplot? (30…
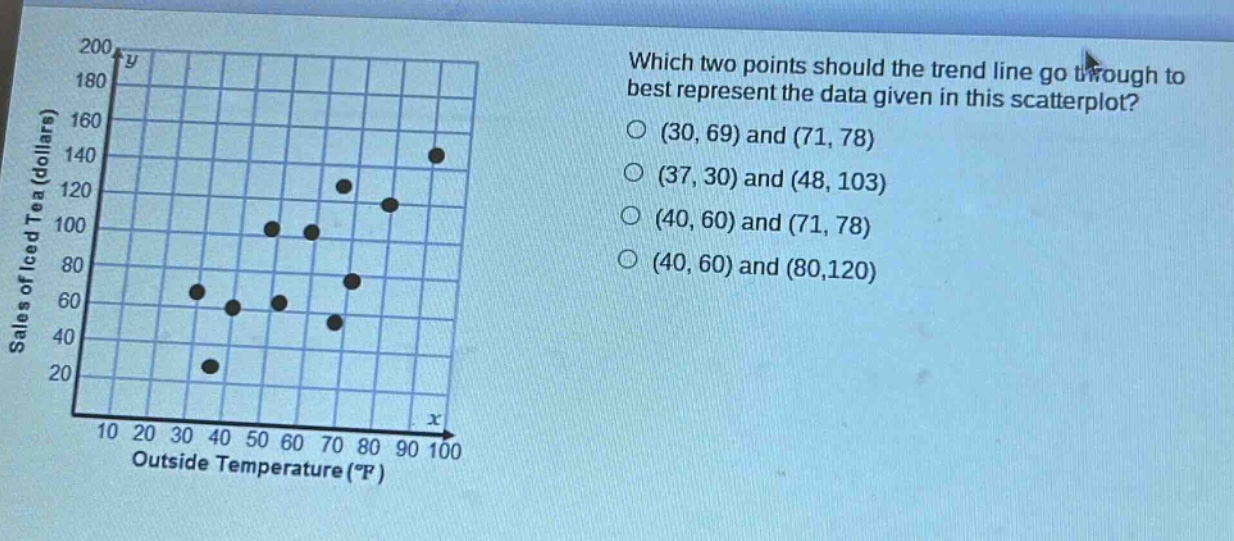
which two points should the trend line go through to best represent the data given in this scatterplot? (30, 69) and (71, 78) (37, 30) and (48, 103) (40, 60) and (71, 78) (40, 60) and (80,120)
Answer
Explanation:
Step1: Visual inspection
A trend - line in a scatter - plot should pass through points that represent the general pattern of the data. We need to look for two points that are in the "center" of the data cloud.
Step2: Analyze each option
- Option 1: (30, 69) and (71, 78) - The first point (30, 69) seems a bit on the lower - left side and may not be a good representative of the overall pattern.
- Option 2: (37, 30) and (48, 103) - The point (37, 30) is an outlier and not a good representative of the data's general trend.
- Option 3: (40, 60) and (71, 78) - These points seem to be in the middle of the data cloud and can represent the general upward trend of the data as temperature increases, sales increase.
- Option 4: (40, 60) and (80, 120) - The point (80, 120) is on the upper - right and may over - emphasize the upper part of the data and not represent the overall pattern as well as the third option.
Answer:
(40, 60) and (71, 78)