the two scatter plots below show the same data set. choose the scatter plot in which the outlier is…
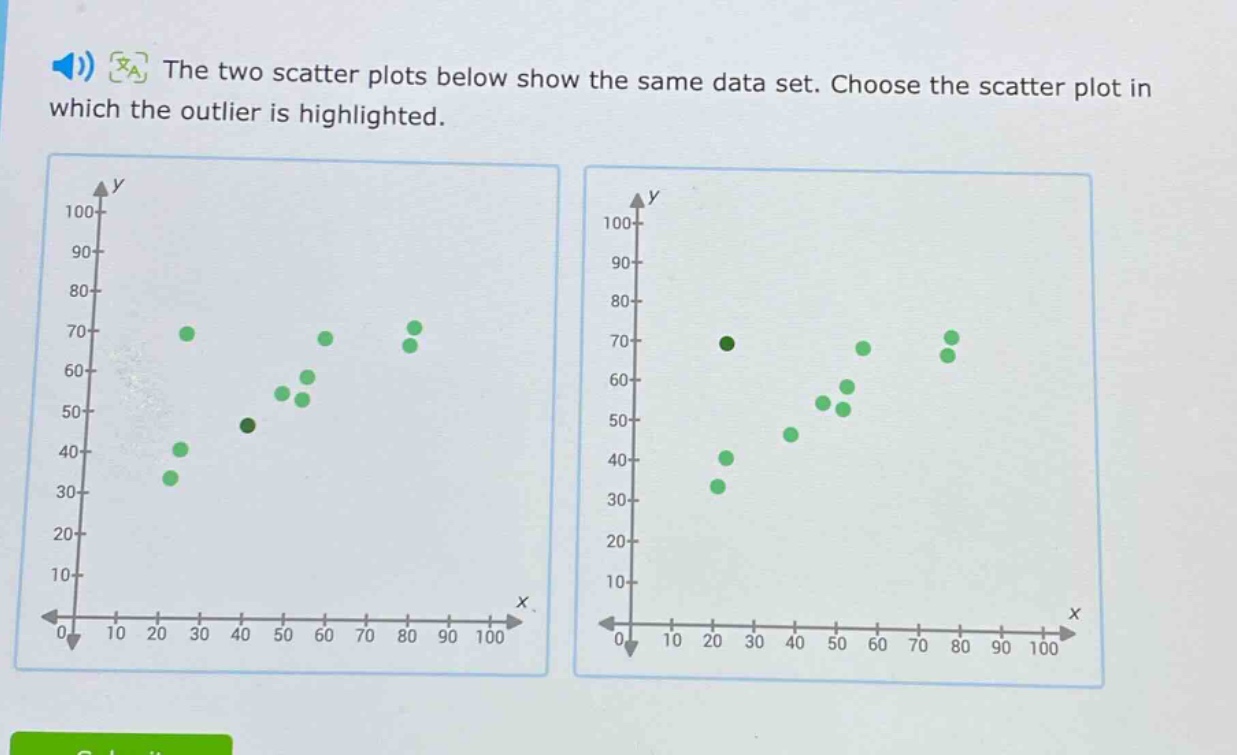
the two scatter plots below show the same data set. choose the scatter plot in which the outlier is highlighted.
Answer
Brief Explanations:
An outlier is a data - point that is significantly different from the other data - points in a dataset. In the second scatter - plot, one data - point (the dark green one) is far away from the general cluster of the other (light green) data - points.
Answer:
The scatter plot on the right.