two science classes with the same number of students took a final exam. the box - and - whisker plots below…
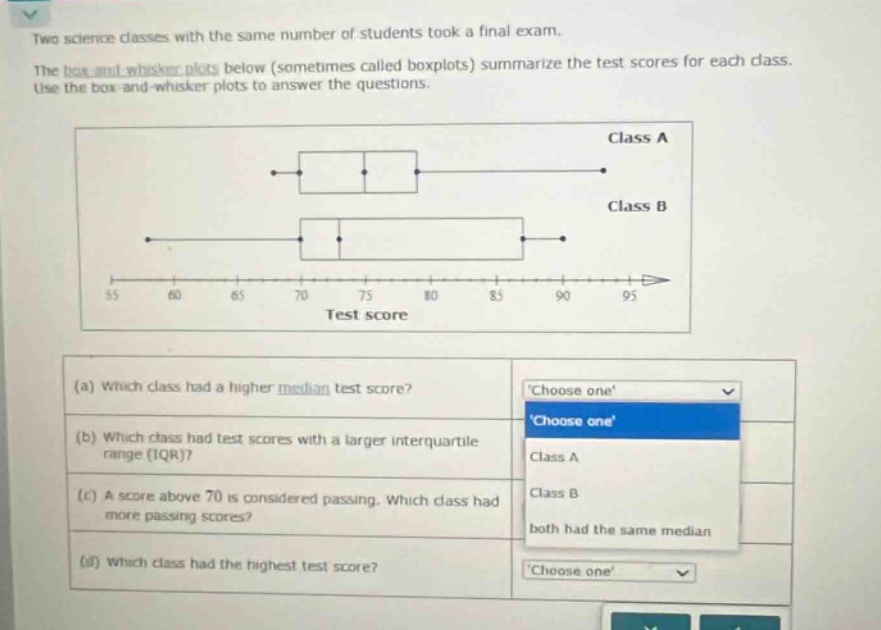
two science classes with the same number of students took a final exam. the box - and - whisker plots below (sometimes called boxplots) summarize the test scores for each class. use the box - and - whisker plots to answer the questions. (a) which class had a higher median test score? (b) which class had test scores with a larger interquartile range (iqr)? (c) a score above 70 is considered passing. which class had more passing scores? (d) which class had the highest test score?
Answer
Explanation:
Step1: Identify median from box - plot
The line inside the box represents the median. For Class A, the median is around 75. For Class B, the median is around 70. So Class A has a higher median.
Step2: Calculate IQR
IQR = Q3 - Q1. For Class A, Q1 is around 70 and Q3 is around 80, so IQR = 80 - 70 = 10. For Class B, Q1 is around 65 and Q3 is around 85, so IQR = 85 - 65 = 20. So Class B has a larger IQR.
Step3: Count passing scores
For scores above 70, in Class A, more than half of the data is above 70. In Class B, less than half of the data is above 70. So Class A has more passing scores.
Step4: Find highest score
The end - point of the right - hand whisker represents the highest score. Class B has the highest score.
Answer:
(a) Class A (b) Class B (c) Class A (d) Class B